Sightseeing Bus Tours Financial Model

- ✔ 5-Year Financial Projections
- ✔ 100% Editable
- ✔ Investor-Approved Valuation Models
- ✔ MAC/PC Compatible, Fully Unlocked
- ✔ No Accounting Or Financial Knowledge
Sightseeing Bus Tours Financial Model
Bundle Includes:
ALL IN ONE MEGA PACK - CONSIST OF:
sightseeing bus tours Financial Model/Business Plan Excel Template
Pitch Deck Template For PowerPoint, Keynote & Google Slides
Business Plan Guide and Business Plan Template in MS Word Format
Financial Dashboard in Excel To Track Your Business Performance
SIGHTSEEING BUS TOURS STARTUP BUDGET INFO
Highlights
The comprehensive five-year financial model template in Excel for sightseeing bus tours incorporates prebuilt three statements, including a consolidated profit and loss statement, balance sheet, and cash flow forecast, designed specifically for the sightseeing tour revenue model. This template facilitates robust ticket sales analysis, customer acquisition cost evaluation, and operational cost structure assessments, enabling accurate financial projections for tours. Furthermore, it assists in strategizing bus tour pricing through a thorough competitive analysis for tours and helps forecast marketing expenses while considering seasonal revenue fluctuations. By leveraging tourist attraction partnerships and exploring tour package customization, users can enhance sightseeing bus profitability. With editable components to suit your specific business needs, this model ultimately supports effective itinerary planning and funding forecasts to secure backing from banks or investors.
The sightseeing bus tours Excel financial projection model addresses key pain points by providing a comprehensive framework for analyzing ticket sales, optimizing the bus tour pricing strategy, and assessing operational cost structures, including bus maintenance costs and itinerary planning expenses. It enables users to conduct a tour demand analysis, forecast seasonal revenue fluctuations, and evaluate customer acquisition costs, ensuring informed decision-making around group tour financing and tourist attraction partnerships. With built-in competitive analysis for tours and industry benchmarking, it helps identify market opportunities, while marketing expense forecasting aids in efficient budget allocation. By simulating various scenarios, the model also supports financial projections for tours and enhances profitability tracking through metrics like customer satisfaction and online booking revenue.
Description
The sightseeing tour revenue model is tailored for both startups and established small to medium-sized enterprises, providing a comprehensive framework to analyze bus tour pricing strategy and project financial outcomes effectively. This financial planning template assists in conducting a tour demand analysis, offering insights into customer acquisition costs and ticket sales analysis, while also considering seasonal revenue fluctuations and operational cost structure, including bus maintenance costs. Additionally, the model allows for detailed financial projections for tours, enabling businesses to forecast marketing expenses and revenue generated through online booking. By evaluating tourist attraction partnerships and offering customizable tour packages, the template supports competitive analysis for tours and enhances overall sightseeing bus profitability, ensuring users can strategically plan for future growth and sustainability.
SIGHTSEEING BUS TOURS FINANCIAL PLAN REPORTS
All in One Place
Unlock your startup's potential with our comprehensive sightseeing bus tours financial model template. Designed for ease of use, this Excel template equips you with essential tools to optimize your revenue model, analyze ticket sales, and develop an effective bus tour pricing strategy. Track operational costs, forecast marketing expenses, and navigate group tour financing effortlessly. By leveraging industry benchmarking and customer satisfaction metrics, you'll enhance profitability and streamline itinerary planning. Elevate your tours with strategic insights that drive demand and support successful transportation service pricing. No financial expertise required—just your vision and our template!

Dashboard
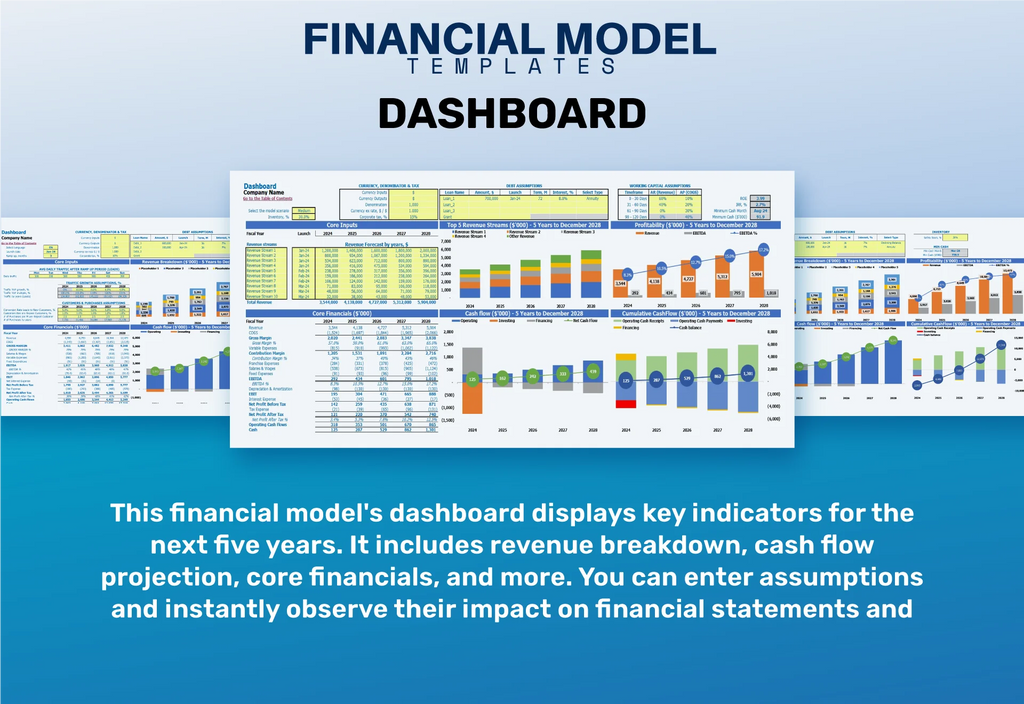
Unlock the potential of your sightseeing tour with a robust revenue model and strategic bus tour pricing. By analyzing tour demand and operational costs, you can optimize profitability while managing seasonal revenue fluctuations. Leverage tourist attraction partnerships to enhance your offerings, and explore tour package customization to attract diverse groups. Effective marketing expense forecasting and customer acquisition cost management will boost ticket sales. Utilize online booking revenue and regularly assess customer satisfaction metrics to refine your service. Competitive analysis and industry benchmarking will ensure your tours stand out. Elevate your business with insightful financial projections that inspire confidence and clarity.

Business Financial Statements
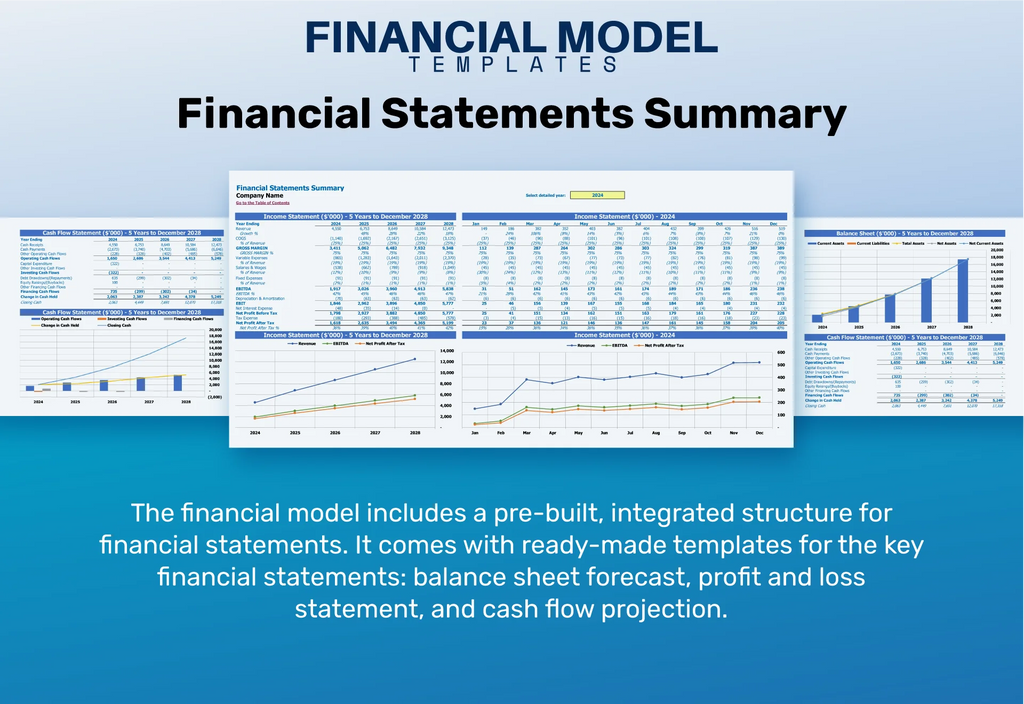
The business's financial health is outlined through three key statements: - **Income Statement**: Captures revenue from ticket sales and operational costs, factoring in depreciation and taxes, to assess overall profitability. - **Balance Sheet**: Details assets, liabilities, and shareholders' equity, ensuring equilibrium in financial reporting. - **Cash Flow Statement**: Tracks cash inflows and outflows, providing insight into operational efficiency and monetary viability. Together, these statements inform strategic decisions regarding sightseeing tour revenue models, pricing strategies, and customer acquisition costs to enhance profitability and operational effectiveness.

Sources And Uses Statement
Utilizing a sources and uses template in Excel is essential for effectively tracking your sightseeing tour revenue model. It provides clarity on income sources—such as ticket sales and online bookings—and helps you analyze operational costs, including bus maintenance and marketing expenses. This structured approach supports financial projections for tours and aids in identifying seasonal revenue fluctuations, ensuring informed decision-making. By monitoring these metrics, you can enhance customer satisfaction, optimize your transportation service pricing, and strategically plan partnerships with tourist attractions to maximize profitability and drive tour demand.

Break Even Point In Sales Dollars
This startup financial plan includes a break-even chart that illustrates the timeline for achieving profitability. By conducting a thorough break-even analysis, we forecast revenue and expenses, creating a robust financial model. This model highlights the projected point at which overall revenue surpasses operational costs, paving the way for enhanced profitability. Incorporating strategies such as a tailored bus tour pricing strategy and strategic partnerships with tourist attractions will further optimize revenue streams and bolster customer satisfaction, allowing us to navigate seasonal fluctuations and achieve sustainable growth.

Top Revenue
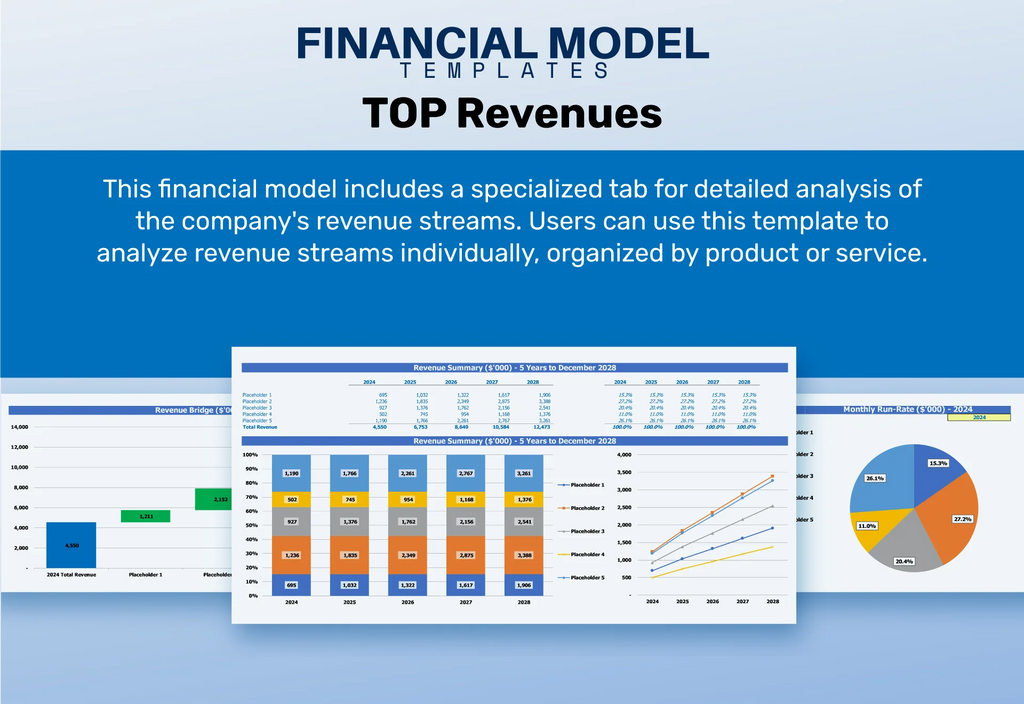
The Top Revenue tab in our pro forma template provides a comprehensive overview of your sightseeing tour revenue model. Utilizing this financial modeling tool, you can analyze annual revenue streams, assess bus tour pricing strategies, and evaluate ticket sales. Gain insights into operational cost structures, including bus maintenance costs and customer acquisition expenses, while forecasting marketing effectiveness. This template empowers you to make informed decisions regarding tour demand analysis, seasonal revenue fluctuations, and competitive positioning, ultimately enhancing profitability and customer satisfaction metrics across your diverse offerings.

Business Top Expenses Spreadsheet
Our financial model for your sightseeing tour business features a streamlined expense tab, highlighting your top four costs while categorizing the remainder under 'Other.' This intuitive startup costs template dynamically calculates expenses based on your tailored assumptions, enabling efficient ticket sales analysis and operational cost structure assessment. With a focus on profitability, it supports strategic decisions regarding bus tour pricing, customer acquisition cost, and marketing expense forecasting, ensuring you’re well-equipped to navigate seasonal revenue fluctuations and maximize partnerships with tourist attractions. Enjoy quick report generation for enhanced itinerary planning and financial projections.

SIGHTSEEING BUS TOURS FINANCIAL PROJECTION EXPENSES
Costs
Our Sightseeing Bus Tours Financial Model offers comprehensive Pro-forma templates that detail costs, expenses, and funding strategies essential for effective budgeting. Understanding your operational cost structure, including bus maintenance costs and marketing expense forecasting, is crucial for ensuring profitability. This model helps you analyze ticket sales and customer acquisition costs, allowing for precise tour demand analysis and competitive analysis for tours. By closely monitoring your financial projections, you can effectively manage seasonal revenue fluctuations and enhance customer satisfaction metrics, paving the way for sustainable growth in your sightseeing bus business.

CAPEX Spending
The initial startup costs serve as a vital tool for analyzing capital expenditures and credit costs, laying the foundation for a robust revenue model. Utilizing a financial projection template can effectively forecast operational expenses, including bus maintenance and itinerary planning costs. This strategic approach not only aids in optimizing the pricing strategy for sightseeing tours, but also enhances ticket sales analysis and customer acquisition costs. By integrating these insights into your business framework, you can better navigate seasonal revenue fluctuations and establish profitable partnerships within the tourist attraction industry.

Loan Financing Calculator
Start-ups and growing companies often require financing to scale operations, necessitating a loan with future interest commitments. Incorporating this into a financial projections model ensures accurate monitoring of cash flow and repayment. The repayment schedule, detailing amounts and maturity terms, is crucial for evaluating operational costs and profitability, particularly in a sightseeing tour revenue model. By analyzing ticket sales and customer acquisition costs, businesses can enhance their bus tour pricing strategy and partnerships with tourist attractions, optimizing their finances and preparing for seasonal revenue fluctuations while maintaining customer satisfaction metrics.

SIGHTSEEING BUS TOURS INCOME STATEMENT METRICS
Financial KPIs
Return on investment (ROI) is a vital financial metric that investors prioritize, reflecting the profitability of a sightseeing tour revenue model. It quantifies the efficiency of cash inflows versus outflows, crucial for assessing the financial projections for tours. Expressed as a percentage, ROI compares net investment gains to total investment costs, informing decisions on bus tour pricing strategy, operational cost structures, and customer acquisition costs. By analyzing ticket sales and implementing competitive analysis for tours, businesses can optimize ROI, enhancing profitability in the dynamic landscape of tourism.

Cash Flow Forecast Excel
The cash balance is a crucial component of our financial model, reflecting the total funds available in the company's accounts. Maintaining an adequate cash reserve ensures we can meet our current obligations and navigate fluctuations in tour demand. By optimizing our sightseeing tour revenue model and bus tour pricing strategy, we can enhance profitability. Strategic partnerships with tourist attractions and effective itinerary planning will improve customer satisfaction metrics, while analyzing ticket sales can guide seasonal revenue forecasting. Ultimately, a robust cash balance supports our growth and sustainability in a competitive touring industry.

KPI Benchmarks
Benchmarking is a vital strategic management tool for assessing a company's performance in the sightseeing tour industry. By analyzing key financial metrics—such as profit margins, operational cost structures, and ticket sales analysis—businesses can identify areas for improvement. Comparing these indicators to industry standards allows companies to gain insights into competitive positioning and operational efficiencies. This practice is particularly valuable for start-ups, enabling them to craft effective pricing strategies, evaluate customer acquisition costs, and enhance customer satisfaction metrics. Ultimately, benchmarking fosters informed decision-making, driving profitability and growth in the dynamic landscape of tour services.

P&L Statement Excel
This pro forma income statement template provides a clear forecast of your sightseeing tour's revenue model, enabling you to analyze ticket sales and operational costs effectively. By leveraging this template, you can assess your bus tour pricing strategy and seasonal revenue fluctuations, helping to identify strengths and weaknesses in your financial projections. This analysis will support informed decision-making for marketing expenses, customer acquisition costs, and tour demand, ultimately enhancing profitability through strategic partnerships and itinerary planning. Use this tool to elevate your business performance and fine-tune your financial strategies for long-term success.

Pro Forma Balance Sheet Template Excel
The balance sheet forecast serves as a vital financial statement showcasing your business's key assets, such as equipment and properties, alongside its liabilities and capital as of a specific date. To secure financing, banks require evidence of loan security reflected in the asset section of your projected balance sheet, typically prepared in Excel format for a five-year term. This demonstrates your operational cost structure and highlights your potential for profitability within the sightseeing tour revenue model, essential for attracting partnerships with tourist attractions and optimizing your bus tour pricing strategy.

SIGHTSEEING BUS TOURS INCOME STATEMENT VALUATION
Startup Valuation Model
All businesses carry inherent risks, which is why we’ve incorporated a startup valuation calculator in our financial model. This tool provides a comprehensive overview of key metrics, including NPV, IRR, and return on invested capital (ROIC). It also encompasses crucial insights on sightseeing tour revenue models, operational cost structures, and customer acquisition costs. By analyzing aggregated customer data, you can effectively forecast future cash flows and enhance your ticket sales analysis. This innovative approach supports sustainable growth while optimizing your transportation service pricing strategy and maximizing sightseeing bus profitability.

Cap Table
Our budget financial model features a streamlined cap table integrated with cash flows, providing a clear overview of funding rounds alongside financial instruments like equity and convertible notes. This cap table effectively demonstrates how strategic decisions influence share ownership and dilution. By aligning our operational cost structure with tour demand analysis and optimizing our sightseeing tour revenue model, we enhance our bus tour pricing strategy. This approach not only boosts ticket sales but also strengthens profitability through effective partnerships and seasonal revenue fluctuations, ensuring robust financial projections for future growth.

KEY FEATURES
Implementing a comprehensive financial model ensures effective budget management, maximizing profitability and optimizing operational costs for sightseeing tours.
A robust cash flow projections model empowers tour operators to optimize pricing strategies, ensuring sustainable profitability and informed decision-making.
Implementing a robust **sightseeing tour revenue model** enhances **financial projections for tours**, ensuring **sustainable profitability** and informed decision-making.
A robust financial model enhances decision-making by accurately forecasting tour profitability and optimizing pricing strategies for increased revenue.
Implementing a robust financial model enhances profitability by optimizing pricing strategies and reducing operational costs for sightseeing tours.
Our comprehensive Excel template streamlines financial reporting, ensuring you meet lender requirements effortlessly while maximizing sightseeing tour profitability.
A robust financial model enhances profitability by optimizing bus tour pricing strategies and streamlining operational costs for increased revenue.
Our sophisticated financial model empowers you to optimize your sightseeing tour revenue, ensuring quick and reliable insights for profitability.
Implementing a robust financial model optimizes bus tour pricing strategies, enhancing profitability through effective customer acquisition and demand analysis.
An effective cash flow projection allows for strategic adjustments, maximizing sightseeing tour profitability through informed decision-making and operational efficiency.
ADVANTAGES
Discover new opportunities for increased profitability and optimized pricing strategies with our comprehensive financial modeling template for sightseeing bus tours.
Optimize your sightseeing tour revenue model with our financial projections, ensuring sustainable profitability and effective operational cost management.
The flexible 5-year startup costs template enhances financial projections for tours, ensuring profitability through strategic pricing and effective cost management.
A robust financial model enhances your sightseeing tour revenue, attracting top talent and ensuring long-term profitability in a competitive market.
The sightseeing tour revenue model enhances profitability by optimizing pricing strategies and minimizing operational costs through effective partnerships and projections.


