


Segway Tours Financial Model

- ✔ 5-Year Financial Projections
- ✔ 100% Editable
- ✔ Investor-Approved Valuation Models
- ✔ MAC/PC Compatible, Fully Unlocked
- ✔ No Accounting Or Financial Knowledge
Segway Tours Financial Model
Bundle Includes:


ALL IN ONE MEGA PACK - CONSIST OF:
segway tours Financial Model/Business Plan Excel Template
Pitch Deck Template For PowerPoint, Keynote & Google Slides
Business Plan Guide and Business Plan Template in MS Word Format
Financial Dashboard in Excel To Track Your Business Performance
SEGWAY TOURS FINANCIAL MODEL FOR STARTUP INFO
Highlights
The Segway tour pricing model will play a crucial role in our tour revenue projections, while an operational cost analysis will help us assess staffing and training expenses, insurance costs for tours, and equipment depreciation rates. Our tour marketing strategy will target local tourism trends to optimize customer acquisition costs and improve customer satisfaction metrics. A thorough competitor pricing comparison will inform our tour package development, enabling us to implement seasonal demand forecasting effectively. Additionally, break-even analysis and profit margin assessment will guide financial forecasting for tours, ensuring robust cash flow management and exploring business scalability options for future growth.
The ready-made financial model in Excel effectively addresses crucial pain points for Segway tour operators by providing a comprehensive overview of key metrics such as tour revenue projections, operational cost analysis, and customer acquisition costs, all tailored to enhance tour marketing strategy. With built-in tools for break-even analysis and profit margin assessment, operators can confidently navigate competitor pricing comparisons and assess local tourism trends. Furthermore, the model incorporates seasonal demand forecasting, insurance costs for tours, and staffing and training expenses, all while factoring in equipment depreciation rates and Segway fleet maintenance, ensuring that business scalability options align with projected cash flow management. By utilizing this model, operators can streamline tour package development and consistently monitor customer satisfaction metrics, leading to informed financial forecasting for tours.
Description
The Segway tours financial model provides a comprehensive analysis for startups in the Segway tour industry, incorporating essential elements such as operational cost analysis, customer acquisition cost, and insurance costs for tours to project tour revenue effectively. It enables detailed seasonal demand forecasting and competitor pricing comparison to refine the tour marketing strategy while assessing profit margins through break-even analysis. By factoring in staffing and training expenses alongside Segway fleet maintenance and equipment depreciation rates, the model assists in cash flow management and financial forecasting for tours, ensuring sustainable business scalability options. Additionally, the online booking system costs and customer satisfaction metrics are integrated to enhance tour package development and overall profitability.
SEGWAY TOURS FINANCIAL MODEL REPORTS
All in One Place
This pro forma Excel template serves as a strategic roadmap for entrepreneurs, enabling them to assess tour revenue projections and operational cost analysis effectively. For startups, this financial forecasting tool highlights essential metrics such as cash flow management and customer acquisition cost. By understanding these dynamics, entrepreneurs can optimize their tour marketing strategy and develop competitive tour packages. Additionally, it assists in break-even analysis and seasonal demand forecasting, ensuring effective resource allocation for staffing, Segway fleet maintenance, and insurance costs. Ultimately, it empowers businesses to achieve desired milestones and enhance profitability while navigating local tourism trends.

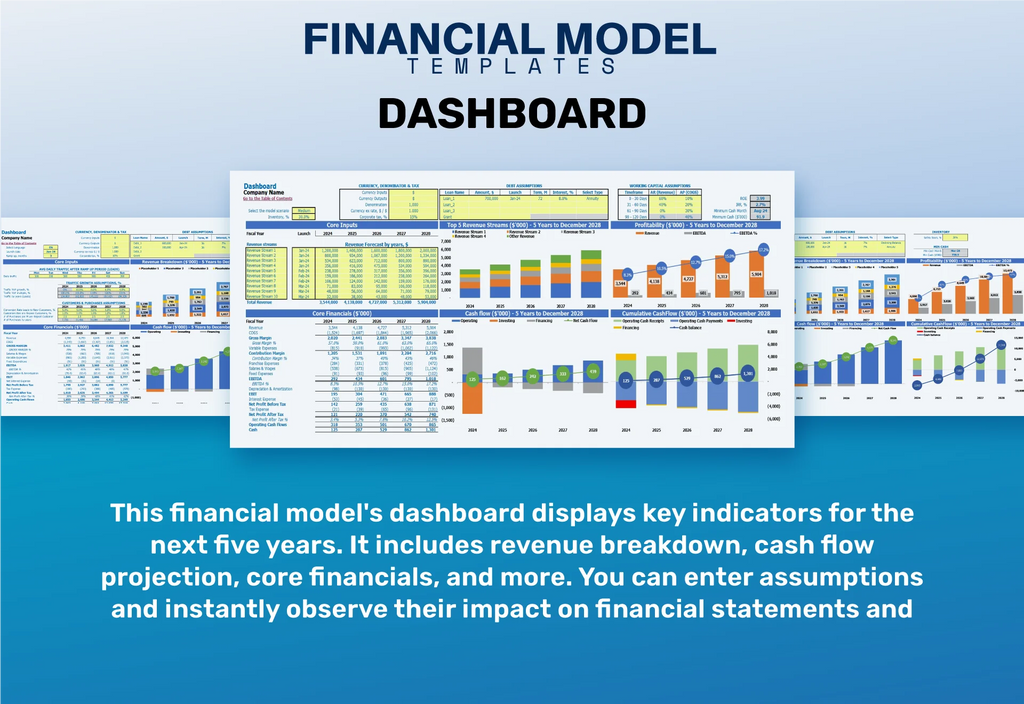
Dashboard
The Dashboard tab of our financial model provides a comprehensive financial snapshot, featuring engaging graphs, charts, and key ratios. Here, you can easily access vital metrics such as tour revenue projections, operational cost analysis, and customer acquisition costs. This user-friendly interface allows you to seamlessly integrate insights on Segway tour pricing models and competitor pricing comparisons into your pitch deck. Leverage our financial summaries to enhance your tour marketing strategy, ensuring optimal cash flow management and profitability through rigorous profit margin assessments and seasonal demand forecasting.
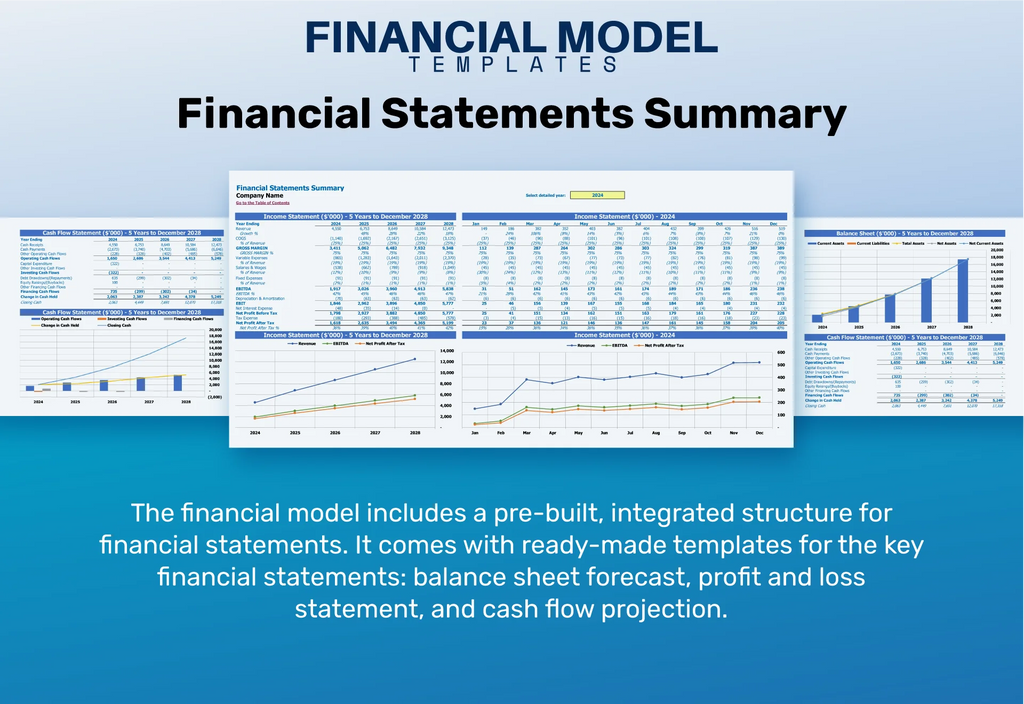
Business Financial Statements
Our financial modeling Excel template offers a comprehensive financial summary that seamlessly integrates data from various supporting spreadsheets. This includes essential components such as the pro forma balance, profit loss projections, and cash flow management tools. Tailored for your pitch deck, our specialists have ensured that key insights like tour revenue projections and operational cost analyses are highlighted. With this user-friendly tool, you can easily assess your Segway tour pricing model, evaluate customer acquisition costs, and forecast seasonal demand, empowering you to make informed decisions and optimize profitability.
Sources And Uses Statement
Our startup's sources and uses of funds statement simplifies financial planning for stakeholders, including lenders. It outlines the required financing and potential funding sources, fostering confidence among current investors about our resilience in unexpected scenarios. In addition to traditional funding, we may explore innovative options, like crowdfunding, to enhance our capital strategy. Equally important, the statement details how we will allocate these funds, ensuring a balanced approach that aligns with our tour revenue projections, operational cost analysis, and growth aspirations within the local tourism market. Transparency and strategic planning are key to our business scalability options.

Break Even Point In Sales Dollars
Break-even analysis is crucial for understanding when a business covers all operational costs with generated revenue. It marks the point where profit and loss balance. Utilizing a cost-volume-profit (CVP) graph helps illustrate the relationship between variable costs, fixed costs, and revenue, providing insights into financial forecasting for tours. Companies with lower fixed costs typically experience a more favorable break-even point, enhancing their profit margin assessment. This analysis informs tour marketing strategy, seasonal demand forecasting, and business scalability options, ultimately enhancing customer acquisition and satisfaction metrics.

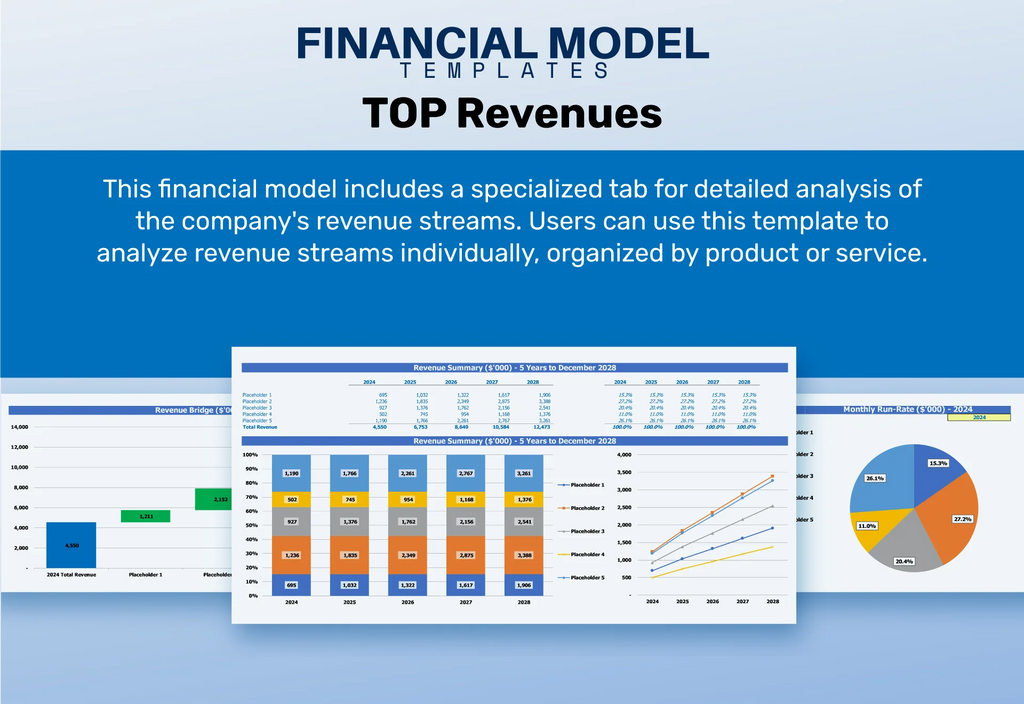
Top Revenue
A sustainable business thrives on effective revenue generation. Management must meticulously forecast future revenues to drive enterprise value within financial projections. An inaccurate forecast can undermine the entire three-statement financial model. To enhance revenue streams, it's crucial to analyze operational costs, customer acquisition, and competitor pricing. Tools like cash flow management, seasonal demand forecasting, and break-even analysis allow for informed decision-making. By utilizing detailed assumptions rooted in historical data, businesses can develop a robust tour marketing strategy, optimize profit margins, and ensure customer satisfaction, ultimately leading to scalable growth and success in the Segway tour industry.
Business Top Expenses Spreadsheet
The startup financial model template, featuring a comprehensive Top Expenses page, enables you to monitor annual expenditures across four key categories. This template supports an operational cost analysis, highlighting customer acquisition costs and fixed expenses. Gaining insight into your revenue projections and cash flow management allows for informed decision-making. By understanding your financial landscape, you can effectively enhance profit margins and develop a robust tour marketing strategy. This clarity not only aids in break-even analysis but also positions your business for scalability amidst evolving local tourism trends.

SEGWAY TOURS FINANCIAL PROJECTION EXPENSES
Costs
Start-up costs are pivotal in shaping a robust financial model for your Segway tour business. Early tracking minimizes underfunding and overspending, ensuring sustainable operations. Our Pro forma template encompasses both funds and expenses, facilitating effective budgeting and financial forecasting for tours. This proactive approach aids in analyzing operational costs, assessing profit margins, and developing a strategic tour marketing strategy. By monitoring customer acquisition costs and evaluating your Segway fleet maintenance, you'll position your business for scalability and efficiency, ultimately driving tour revenue and enhancing customer satisfaction metrics.

CAPEX Spending
A capital expenditure (CAPEX) schedule outlines investments vital for business growth, such as Segway fleet maintenance or new tour package development. This budget focuses on expanding operations or launching innovative offerings. While these expenditures don't appear directly in the pro forma income statement, they are recorded as assets on the projected balance sheet, with depreciation expenses accounted for over time. Understanding CAPEX is essential for tour revenue projections, break-even analysis, and ensuring a healthy profit margin assessment while managing cash flow and aligning with local tourism trends.

Loan Financing Calculator
Start-ups and growing companies often require funding to scale operations, which may involve securing a loan. This commitment should be reflected in the financial forecasting for tours, including a detailed repayment schedule in your pro forma model. Incorporating this schedule into cash flow management and operational cost analysis is essential, as it influences the projected income statement, balance sheet, and key financial metrics. By monitoring changes in these ratios, businesses can gain insights into their profit margin assessment and refine their tour marketing strategy, ultimately enhancing customer acquisition and satisfaction.

SEGWAY TOURS EXCEL FINANCIAL MODEL METRICS
Financial KPIs
Earnings Before Interest and Taxes (EBIT), often referred to as operational income, is a key profit metric in our five-year financial forecasting for tours. This measure highlights the gap between tour revenues and operational costs, including sales expenses, loan interest, and taxes. It serves as a crucial indicator of the company's ability to generate profit, guiding our tour marketing strategy and pricing model. By analyzing EBIT, we can assess profit margins, evaluate local tourism trends, and refine tour package development to enhance customer satisfaction while ensuring business scalability and effective cash flow management.

Cash Flow Forecast Excel
A well-structured cash flow analysis spreadsheet is essential for optimizing financial performance. It provides clear insights into tour revenue projections, operational costs, and customer acquisition costs. By effectively leveraging this tool, businesses can conduct break-even analysis and assess profit margins. It enables a thorough evaluation of cash inflows and outflows, facilitating informed decision-making regarding tour package development and marketing strategies. Additionally, it aids in seasonal demand forecasting and competitor pricing comparison, ultimately driving customer satisfaction metrics and enhancing overall business scalability. This real-time tracker of capital activity empowers savvy operators to maximize tour profitability and efficiency.

KPI Benchmarks
Our five-year financial projection template includes a benchmarking tool that enables clients to compare their Segway tour pricing model and performance against industry standards. This resource highlights key metrics such as tour revenue projections, operational cost analysis, and competitor pricing comparisons, helping firms identify areas for improvement. By leveraging insights on customer acquisition cost and seasonal demand forecasting, businesses can enhance their tour marketing strategy and optimize profit margins. This template empowers you to develop effective tour packages and implement strategic cash flow management for sustained growth and scalability in the local tourism market.

P&L Statement Excel
This expertly crafted startup financial model template is accessible to all, requiring only basic computer skills. It includes a comprehensive profit and loss statement that illuminates your income and operational costs, enabling you to refine your tour marketing strategy and optimize your Segway tour pricing model. By analyzing customer acquisition costs and conducting break-even analysis, you can project tour revenue and assess profit margins effectively. Leverage this tool to enhance cash flow management, forecast seasonal demand, and evaluate local tourism trends, ensuring your business scales successfully while maintaining customer satisfaction metrics.

Pro Forma Balance Sheet Template Excel
A balance sheet forecast provides a snapshot of your business’s financial position, detailing assets and liabilities at a specific moment. In contrast, an income and expenditure template tracks operational performance over time. A pro forma balance reveals the company's net worth, highlighting the gap between equity and debt obligations. Among the three core financial statements, the balance sheet is crucial for calculating key metrics like liquidity and turnover ratios, which inform strategic decisions such as tour revenue projections, operational cost analysis, and overall business scalability options.

SEGWAY TOURS FINANCIAL PROJECTION TEMPLATE VALUATION
Startup Valuation Model
In the context of Segway tours, understanding financial metrics like the Weighted Average Cost of Capital (WACC) and Discounted Cash Flows (DCF) is essential for effective tour revenue projections. WACC assesses capital costs, helping to gauge risk for potential investors. Meanwhile, DCF analysis highlights the value of future cash flows, guiding operational cost analysis and cash flow management. By integrating these metrics into your tour marketing strategy, you can enhance customer acquisition strategies while maintaining a healthy profit margin assessment and ensuring your business scalability options align with local tourism trends.

Cap Table
Our financial projection model incorporates advanced proformas for calculating discounted cash flows, alongside sales and EBITDA valuations on the income statement. Business owners can leverage these insights to assess exit values and forecast investor returns effectively. Users have the flexibility to utilize the pro forma cap table or omit it, ensuring it won’t adversely affect other calculations within the bottom-up financial model. This streamlined approach enhances your Segway tour pricing model, enabling better tour revenue projections and informed decision-making for cash flow management and profitability assessments.

KEY FEATURES
Implementing a robust financial model optimizes Segway tour pricing, boosting profitability while streamlining operations and enhancing customer satisfaction.
The Segway tours financial model streamlines planning, enabling you to focus on growth rather than technical complexities and costs.
Our financial model enhances profitability through precise tour revenue projections and effective customer acquisition cost management.
A comprehensive financial model enhances tour revenue projections and simplifies operational cost analysis for effective Segway tour management.
Our integrated financial model optimizes tour revenue projections while minimizing operational costs, ensuring sustainable growth and profitability.
Our financial model effectively connects key metrics, enhancing profitability through accurate revenue projections and cost analysis for Segway tours.
Implementing a robust financial model ensures sustainable profit margins while optimizing your Segway tour pricing strategy and customer acquisition costs.
Implementing a robust cash flow forecasting model enhances financial stability and prepares your Segway tour business for market fluctuations.
Our convenient all-in-one dashboard enhances decision-making by integrating financial forecasting for tours, ensuring optimal profitability and customer satisfaction.
Our comprehensive financial model enhances decision-making through detailed projections, ensuring profitability and strategic growth for your Segway tour business.
ADVANTAGES
A solid financial forecasting model enhances investor confidence and supports effective cash flow management for sustained business growth.
The Segway tour financial model streamlines operational cost analysis and enhances profit margin assessment for scalable business growth.
A robust financial model enhances profitability through effective cost analysis, pricing strategies, and revenue projections for Segway tours.
A robust financial model for Segway tours enhances profitability through effective pricing, cost analysis, and strategic revenue forecasting.
The five-year financial forecasting model effectively monitors spending against tour revenue projections, ensuring operational efficiency and profitability.