Obstacle Course Race Financial Model

- ✔ 5-Year Financial Projections
- ✔ 100% Editable
- ✔ Investor-Approved Valuation Models
- ✔ MAC/PC Compatible, Fully Unlocked
- ✔ No Accounting Or Financial Knowledge
Obstacle Course Race Financial Model
Bundle Includes:
ALL IN ONE MEGA PACK - CONSIST OF:
obstacle course race Financial Model/Business Plan Excel Template
Pitch Deck Template For PowerPoint, Keynote & Google Slides
Business Plan Guide and Business Plan Template in MS Word Format
Financial Dashboard in Excel To Track Your Business Performance
OBSTACLE COURSE RACE FINANCIAL MODEL FOR STARTUP INFO
Highlights
An effective obstacle course race financial model template in Excel is essential for both startups and established companies aiming to optimize their event planning budget and assess pricing strategies for race registration fees. This tool facilitates a comprehensive cost analysis for obstacle racing, enabling race organizers to understand essential expenses such as insurance costs, marketing expenses for races, and track maintenance expenses. By analyzing participant demographics and integrating a robust sponsorship revenue model, organizers can enhance cash flow management for events and identify vendor partnerships profit. Furthermore, financial forecasting for obstacle courses allows for accurate ticket sales projections, ensuring a healthy profit margin in race events. Ultimately, this financial model aids in break-even analysis for races and evaluates performance metrics, driving better decision-making and improved race marketing ROI while fostering community engagement.
This comprehensive obstacle course race financial model simplifies the management of key pain points by offering a streamlined approach to forecasting race registration fees, analyzing sponsorship revenue models, and evaluating marketing expenses for races, all while keeping track of operational costs like insurance, track maintenance, and equipment rental. Users can easily conduct a break-even analysis for races and monitor profit margins, ensuring a clear understanding of cash flow management and vendor partnerships profit. Additionally, the model allows for precise ticket sales projections and participant demographics evaluation, which aid in crafting effective event planning budgets and marketing strategies. With automated performance metrics and integrated reports, event planners can seamlessly adapt to changes in financial variables, ultimately enhancing community engagement and maximizing race marketing ROI.
Description
The obstacle course race financial model is a comprehensive and intuitive Excel template that facilitates the development of a detailed financial plan encompassing projected profit and loss statements, pro forma balance sheets, and cash flow forecasts tailored for both startup and established racing events. This adaptable tool allows users to conduct a cost analysis for obstacle racing, incorporating race registration fees, marketing expenses for races, and insurance costs for events, while also estimating sponsorship revenue models and vendor partnerships profit. By analyzing participant demographics and community engagement costs, the model aids in strategic decision-making regarding ticket sales projections and break-even analysis for races. Additionally, it offers insights into equipment rental financials, track maintenance expenses, and operational costs, ensuring effective cash flow management and financial forecasting capabilities vital for achieving a sustainable profit margin in race events.
OBSTACLE COURSE RACE FINANCIAL MODEL REPORTS
All in One Place
Our financial projection model is designed for ease of use and adaptability, catering to your event planning needs. With integrated formulas, any adjustments you make are instantly reflected across all worksheets, ensuring accurate financial forecasting for your obstacle course race. Assumptions are neatly compiled in one centralized section, allowing for seamless updates. Simply input your revised parameters into the highlighted cells, and watch as the model automatically generates projections for race registration fees, sponsorship revenue, and operational costs, empowering you to maximize profit margins and enhance marketing ROI efficiently.

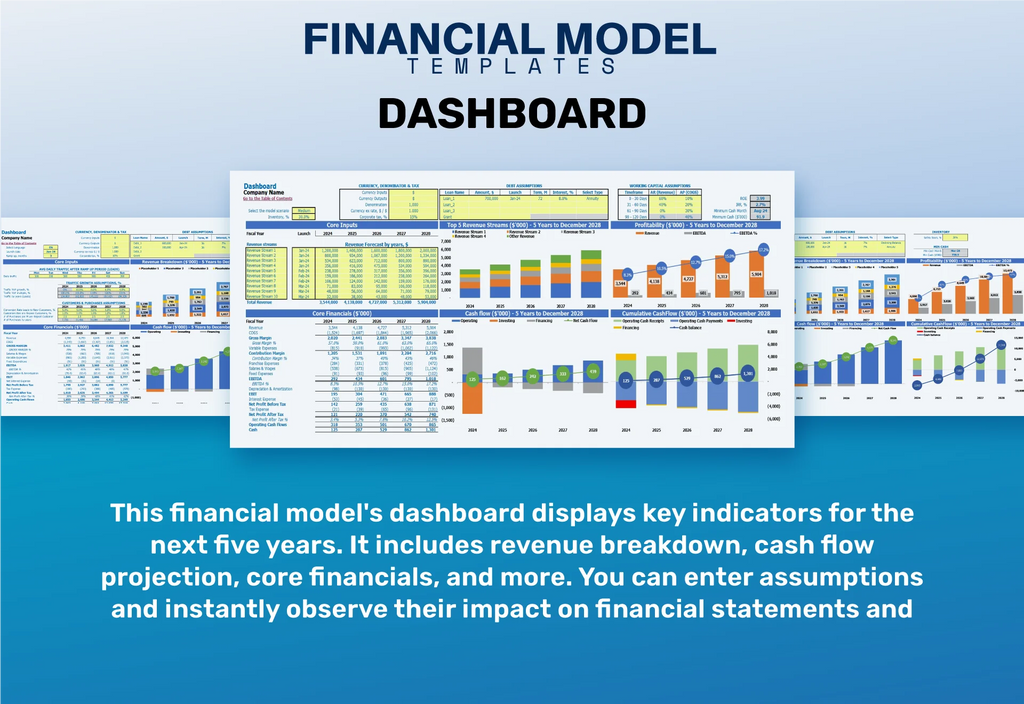
Dashboard
An interactive dashboard showcasing essential financial indicators is vital for any startup's financial planning. This tool integrates crucial data from financial statements and projections, allowing users to explore specific time periods for in-depth analysis. By focusing on key performance metrics such as race registration fees, event operational costs, and sponsorship revenue models, users can enhance their understanding of cash flow management and break-even analysis. With this insight, strategic decisions can be made to optimize the pricing strategy, marketing ROI, and ultimately improve profit margins in obstacle course racing events.

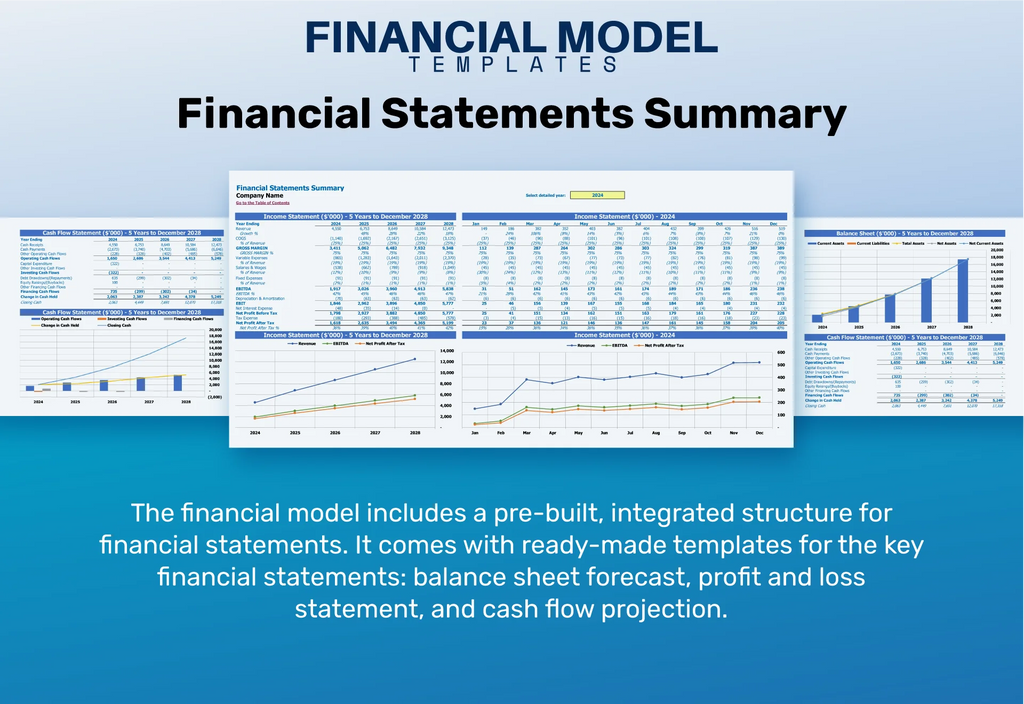
Business Financial Statements
Our comprehensive financial model template for obstacle course racing consolidates crucial data from multiple spreadsheets. It incorporates essential components such as projected balance sheets, income statements, and cash flow analysis. Specifically designed for event planning, our model helps you navigate obstacle course race pricing strategies, race registration fees, and sponsorship revenue models. Additionally, it provides insights into marketing expenses, insurance costs, and equipment rentals, ensuring a solid foundation for effective financial forecasting. With our structured financial overview, you'll be well-prepared to enhance your pitch deck and maximize profitability in your racing events.

Sources And Uses Statement
The sources and uses template in Excel is essential for financial forecasting in obstacle course races, enabling effective management of race registration fees, marketing expenses, and operational costs. This tool aids in analyzing sponsorship revenue models and participant demographics, ensuring a solid understanding of cash flow management. By facilitating a break-even analysis, it empowers event planners to optimize cost analysis for obstacle racing, track maintenance expenses, and equipment rental financials, ultimately enhancing the profit margin in race events while maximizing ROI from marketing initiatives. Engaging vendors and community partnerships can further elevate success.

Break Even Point In Sales Dollars
Break-even analysis is essential for obstacle course race organizers, determining when revenue covers all operational costs, including race registration fees and insurance costs. Understanding the relationship between fixed and variable expenses helps in optimizing the event planning budget. Companies with lower fixed costs typically achieve a more favorable break-even point. Effective financial forecasting, coupled with strategic sponsorship revenue models and vendor partnerships, enhances cash flow management and supports robust marketing efforts. By analyzing participant demographics and performance metrics, organizers can improve ticket sales projections and maximize profit margins while engaging the community effectively.

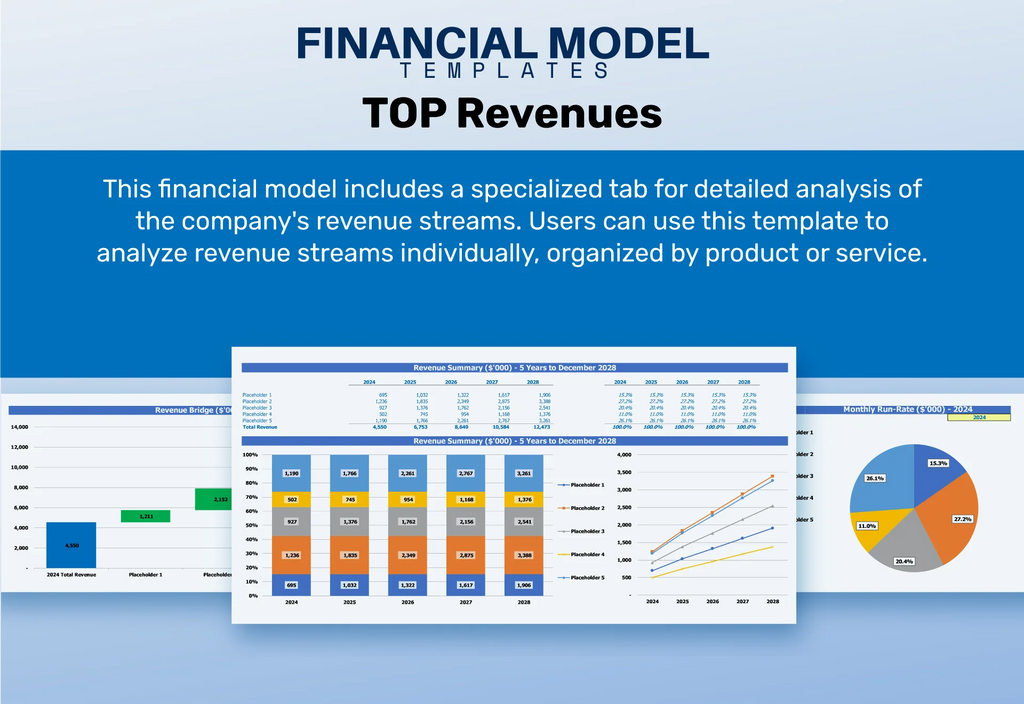
Top Revenue
In the financial landscape of obstacle course racing, the top line represents gross revenue generated from race registration fees and sponsorships, while the bottom line reflects net profits after accounting for operational costs like insurance, marketing expenses, and track maintenance. Investors and analysts closely monitor these metrics, as top-line growth signals increased participant demographics and engagement, which can enhance the profit margin. Effective financial forecasting and break-even analysis are crucial for optimizing pricing strategy and cash flow management, ultimately driving success in this competitive event market.

Business Top Expenses Spreadsheet
This five-year financial projection template features a comprehensive "Top Expenses" tab, categorizing costs into four main areas and an "Other" category for miscellaneous expenses. Ideal for event planning, it facilitates a detailed cost analysis for obstacle racing, encompassing race registration fees, insurance costs, and marketing expenses. By accurately tracking these expenses alongside sponsorship revenue models, participants demographics, and vendor partnerships, organizations can improve their profit margins and enhance cash flow management. Leverage this template to perform break-even analyses and optimize financial forecasting for successful race events.

OBSTACLE COURSE RACE FINANCIAL PROJECTION EXPENSES
Costs
To effectively manage your obstacle course race's financial landscape, our Profit Loss Projection tool offers unparalleled clarity. This innovative resource provides insights into race registration fees, sponsorship revenue models, and operational costs. Whether you're strategizing for event planning budgets or evaluating ticket sales projections, our financial plan template is essential for securing loans and impressing investors. Achieve your objectives with a comprehensive view of cost analysis, cash flow management, and marketing ROI, enabling informed decisions that enhance your profit margin and community engagement efforts. Elevate your event's financial success today.

CAPEX Spending
The capital expenditure budget outlines a company’s investments aimed at acquiring valuable assets that promise future benefits. Utilizing a startup financial model template allows for precise cost analysis, crucial in assessing the long-term viability of obstacle course race pricing strategies and event planning budgets. It's essential for business professionals to differentiate capital expenditures from financial statements or depreciation. Proper financial forecasting for obstacle racing can enhance profit margins through strategic planning of race registration fees, sponsorship revenue models, and cash flow management, ensuring sustainable growth and community engagement.

Loan Financing Calculator
Our five-year financial projection template offers a comprehensive loan amortization schedule, seamlessly integrating principal and interest calculations. This user-friendly tool enables you to determine your payment amounts by inputting the principal, interest rate, loan duration, and payment frequency. Ideal for enhancing your obstacle course race pricing strategy and event planning budget, this template supports effective cost analysis for obstacle racing, ensuring a clear understanding of your cash flow management for events and helping to boost your profit margins through strategic financial forecasting.

OBSTACLE COURSE RACE EXCEL FINANCIAL MODEL METRICS
Financial KPIs
Streamline your event's financial performance with our user-friendly financial model template! Track key performance indicators (KPIs) over 24 months to 5 years, tailored to your needs. Gain insights into your obstacle course race pricing strategy with comprehensive metrics, including EBITDA/EBIT to assess profitability, cash flow management for events, and break-even analysis for races. Monitor insurance costs, marketing expenses, and vendor partnerships profit to maximize your returns. Ensure robust financial forecasting and maintain liquidity with a clear cash balance overview. Elevate your event planning budget to achieve exceptional results in your obstacle course racing ventures!

Cash Flow Forecast Excel
A cash flow proforma template effectively illustrates the fluctuations in cash balance over a specified period, highlighting both inflows and outflows of funds. This tool is essential for event planning budgets, enabling event organizers to strategically assess race registration fees, sponsorship revenue models, and marketing expenses for races. By incorporating cost analysis for obstacle racing, including insurance costs and track maintenance expenses, organizers can enhance their financial forecasting and break-even analysis. Ultimately, this ensures a robust understanding of profit margins and community engagement costs for successful obstacle course races.

KPI Benchmarks
Our financial projection template excels in benchmarking for obstacle course races. By analyzing industry and financial standards, clients gain valuable insights into their event planning budget, including race registration fees and marketing expenses. This tool facilitates a comprehensive cost analysis for obstacle racing, enabling users to evaluate participant demographics and sponsorship revenue models. With an emphasis on break-even analysis, cash flow management, and performance metrics, our template helps identify areas for improvement, ensuring optimal profitability and effective community engagement for each race.

P&L Statement Excel
The Profit and Loss Statement, often referred to as the Income Statement, is crucial for investors evaluating your obstacle course race's financial health. This document details revenues, race registration fees, marketing expenses, and operational costs, providing insights into profitability and cash flow management. By analyzing projected figures, stakeholders can assess future performance and refine the pricing strategy, optimizing sponsorship revenue and vendor partnerships. Additionally, this financial tool aids in conducting a break-even analysis and understanding participant demographics, ensuring informed decisions that enhance your event's success and community engagement.

Pro Forma Balance Sheet Template Excel
A pro forma balance sheet template is essential for effective financial forecasting in event planning, particularly for obstacle course races. This tool provides a comprehensive overview of current and long-term assets, liabilities, and shareholders' equity, enabling accurate cost analysis for obstacle racing. By utilizing this template, organizers can better manage operational costs, race registration fees, and sponsorship revenue models, ensuring an optimal profit margin. Additionally, it aids in assessing cash flow management and supports strategic decisions related to vendor partnerships and community engagement, ultimately enhancing marketing ROI and overall event success.

OBSTACLE COURSE RACE FINANCIAL PROJECTION TEMPLATE VALUATION
Startup Valuation Model
Our five-year financial projection template offers a comprehensive analysis for obstacle course races, incorporating essential valuation methods. With integrated discounted cash flow (DCF) and weighted average cost of capital (WACC) calculations, it provides insights into race registration fees, sponsorship revenue models, and marketing ROI. This tool aids in cost analysis for obstacle racing, ensuring informed decision-making regarding operational costs, insurance, and equipment rental financials. Utilize this template to optimize your event planning budget and enhance cash flow management, ultimately driving profitability and community engagement throughout your race events.

Cap Table
The financial model Excel includes integrated proformas for calculating discounted cash flows and evaluating earnings before interest, taxes, and depreciation. Business owners can leverage these valuations to determine exit values and project returns for investors, ultimately enhancing their obstacle course race pricing strategy. Users have the option to utilize the cap table without negatively affecting other financial projections. This comprehensive approach allows for effective analysis of event planning budgets, participant demographics, sponsorship revenue models, and operational costs, ensuring a robust framework for financial forecasting in obstacle racing.

KEY FEATURES
Implementing a comprehensive financial model ensures sustainable profit margins and effective budgeting for successful obstacle course races.
Understanding the financial model for obstacle course races enhances funding success and attracts investors, ensuring sustainable growth and profitability.
Implementing a comprehensive financial model for obstacle course races minimizes costs and maximizes profit margins, saving time and money.
An effective financial model streamlines planning, ensuring profitability while minimizing complexities in your obstacle course race operations.
A robust financial model enhances profit margins by optimizing pricing strategy and minimizing operational costs in obstacle course races.
A robust financial model streamlines cash flow management for events, letting you focus on enhancing customer experience and business growth.
A robust financial model enhances cash flow management and maximizes profit margins for obstacle course races, ensuring great value for participants.
Unlock your race's profitability with our proven 5-year financial projection template, ensuring transparent pricing and no hidden fees.
A comprehensive financial model maximizes profit margins through effective cost analysis and strategic sponsorship revenue for obstacle course races.
Our Excel template streamlines financial reporting for obstacle course races, ensuring precise income projections and simplified cash flow management.
ADVANTAGES
Maximize your obstacle course race profitability with our 5-year cash flow projection template for strategic financial planning.
Unlock profitability with a comprehensive financial model for obstacle course races, optimizing costs and maximizing sponsorship and ticket sales.
Evaluate your obstacle course race idea's viability with a robust financial projection model for optimal cash flow management.
A robust financial model enhances profitability by optimizing race registration fees, sponsorships, and operational costs for obstacle course events.
A well-structured financial model enhances profitability by optimizing race registration fees and maximizing sponsorship revenue for obstacle course events.


