


Natural Stone Manufacturing Financial Model

- ✔ 5-Year Financial Projections
- ✔ 100% Editable
- ✔ Investor-Approved Valuation Models
- ✔ MAC/PC Compatible, Fully Unlocked
- ✔ No Accounting Or Financial Knowledge
Natural Stone Manufacturing Financial Model
Bundle Includes:


ALL IN ONE MEGA PACK - CONSIST OF:
natural stone manufacturing Financial Model/Business Plan Excel Template
Pitch Deck Template For PowerPoint, Keynote & Google Slides
Business Plan Guide and Business Plan Template in MS Word Format
Financial Dashboard in Excel To Track Your Business Performance
NATURAL STONE MANUFACTURING FINANCIAL MODEL FOR STARTUP INFO
Highlights
The five-year financial model template in Excel is designed specifically for the natural stone industry, providing a comprehensive analysis of the stone manufacturing revenue model with prebuilt consolidated projected profit and loss statements, balance sheets, and forecast cash flow statements. This template not only includes key financial charts and summaries, but also offers insights into financial health indicators for stone enterprises, essential for understanding cost structures of natural stone production and evaluating profit margins in the stone industry. With a focus on capital investment in stone manufacturing, this model enables users to conduct financial forecasting for stone producers and create effective sales strategies for natural stone products. Moreover, the built-in metrics facilitate breakeven analysis for natural stone, while guiding businesses in navigating investment risks and optimizing cash flow management. By utilizing this tool, stakeholders can better assess market trends in natural stone, explore export opportunities, and implement sustainability practices, ultimately enhancing operational efficiency and positioning themselves for funding from banks, angels, grants, and venture capital funds.
The ready-made financial model in Excel addresses key pain points in the natural stone industry by offering a comprehensive analysis of market trends and operational costs, which helps businesses enhance decision-making around capital investment and sales strategies. By incorporating financial forecasting tools, it aids in projecting stone manufacturing revenue and profit margins while facilitating effective cash flow management and evaluating the cost structure of natural stone production. The model’s focus on breakeven analysis and investment risks mitigates uncertainties for stone producers, while summary tabs for metrics like NPV and IRR allow for clear insights into financial health indicators and performance metrics. Additionally, the emphasis on regulatory considerations and sustainability practices aligns with current market demands, making it an essential tool for navigating challenges in the stone manufacturing landscape and optimizing production efficiency.
Description
The financial model overview outlines a comprehensive 5-year financial statement plan tailored for the natural stone industry, supporting both startups and established businesses. This model incorporates essential components such as financial projections for stone businesses, including industry-specific revenue assumptions and detailed financial reports like pro forma profit and loss statements, projected balance sheets, and cash flow analyses. Designed to capture market trends in natural stone, the model also features performance KPIs and valuation charts that provide insight into cost structures, profit margins, and breakeven analysis for natural stone production. With an emphasis on capital investment and the economic impact of stone industries, this financial tool aids in cash flow management while addressing investment risks and opportunities for sustainable practices, ultimately facilitating informed strategic decisions for stakeholders in the stone manufacturing sector.
NATURAL STONE MANUFACTURING FINANCIAL MODEL REPORTS
All in One Place
The professional startup pro forma template offers insights into the financial future of your natural stone business. By generating projected financial statements—such as profit and loss, balance sheets, and cash flow forecasts—this comprehensive model supports your capital investment decisions. It also calculates key performance indicators (KPIs) based on your assumptions, empowering you to analyze market trends and cost structures effectively. With a visually appealing dashboard to present these metrics, you'll gain clarity on financial health indicators and engage in strategic planning for sustainable growth in the natural stone industry.

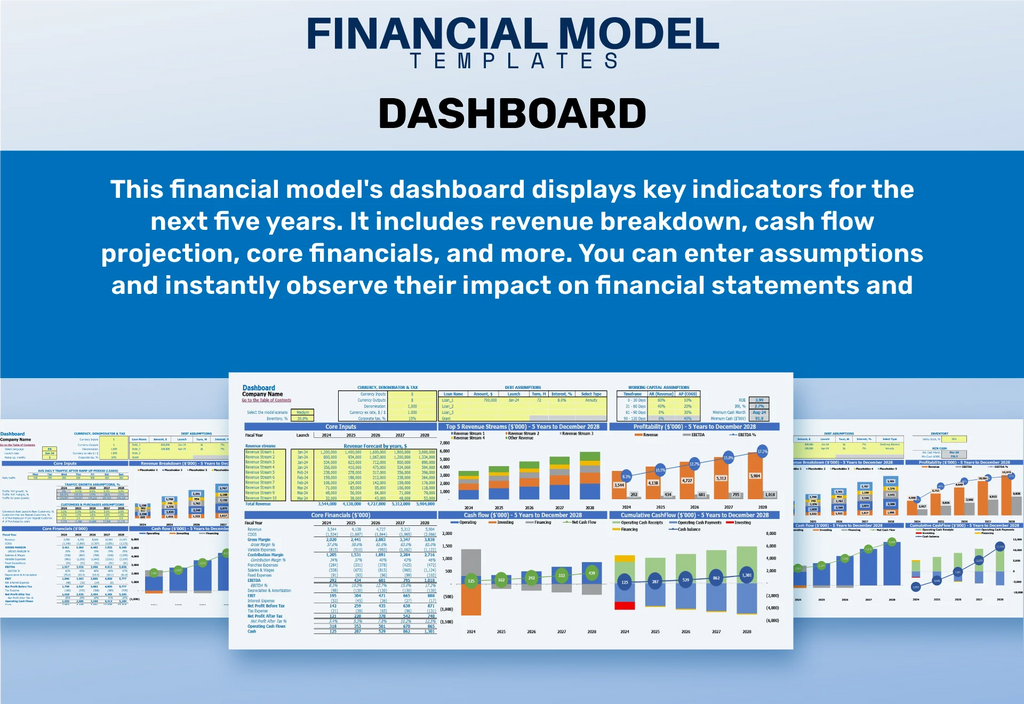
Dashboard
Our 5-year cash flow projection template features an advanced financial dashboard tailored for effective planning and analysis in the natural stone industry. Utilizing precise charts and graphs, it ensures accuracy in financial reporting. This tool allows for in-depth analysis of financial statements, empowering stakeholders with essential insights for informed decision-making. By integrating metrics related to stone manufacturing revenue models, breakeven analysis, and market trends, the dashboard is instrumental for financial forecasting and strategic planning, ultimately enhancing financial health and guiding investment opportunities in the stone production sector.
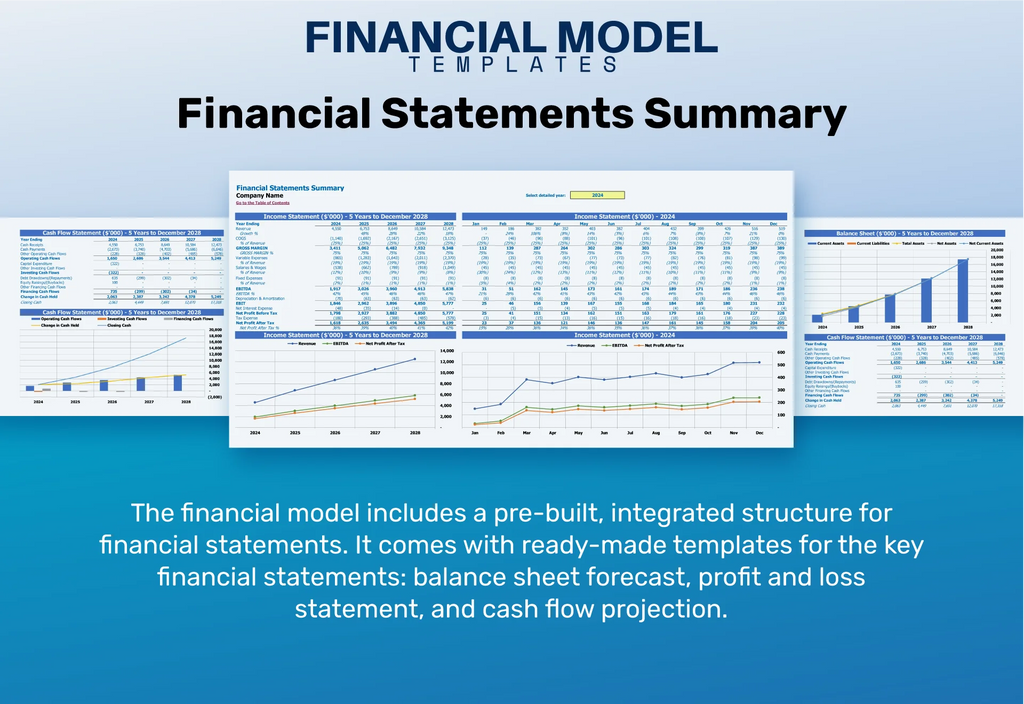
Business Financial Statements
In the natural stone industry, understanding financial performance is vital. The profit and loss statement highlights income and expenses, revealing the profitability of core operations. The projected balance sheet provides insights into capital investment and financial position over five years, while the cash flow forecast tracks operational, investing, and financing activities. Together, these financial statements enable stone producers to assess financial health indicators, manage cash flow effectively, and strategize for market trends. This comprehensive analysis aids in optimizing costs, enhancing production efficiency, and navigating investment risks, ultimately bolstering profit margins in the competitive stone manufacturing sector.
Sources And Uses Statement
In the natural stone industry, understanding the sources and uses of capital is vital for creating a robust financial plan. This analysis reveals critical funding sources and how cash flows are allocated, directly influencing operational efficiency and investment strategies. By examining financial health indicators and crafting effective pricing models, stone producers can enhance profit margins while managing cash flow. Additionally, integrating sustainability practices and regulatory considerations into the capital investment framework will unlock new opportunities for growth, ensuring long-term success in a competitive market.

Break Even Point In Sales Dollars
A five-year breakeven analysis provides a clear overview of profit potential across different sales levels in the natural stone industry. Breakeven in unit sales signifies the threshold where total revenue matches fixed costs, resulting in neither profit nor loss. This method leverages marginal costing, highlighting distinct cost behaviors at various output levels. Understanding this financial forecasting tool is crucial for optimizing pricing models, enhancing production efficiency, and effectively managing cash flow. It also aids in navigating market trends, evaluating investment risks, and developing robust sales strategies for sustained growth in stone manufacturing.

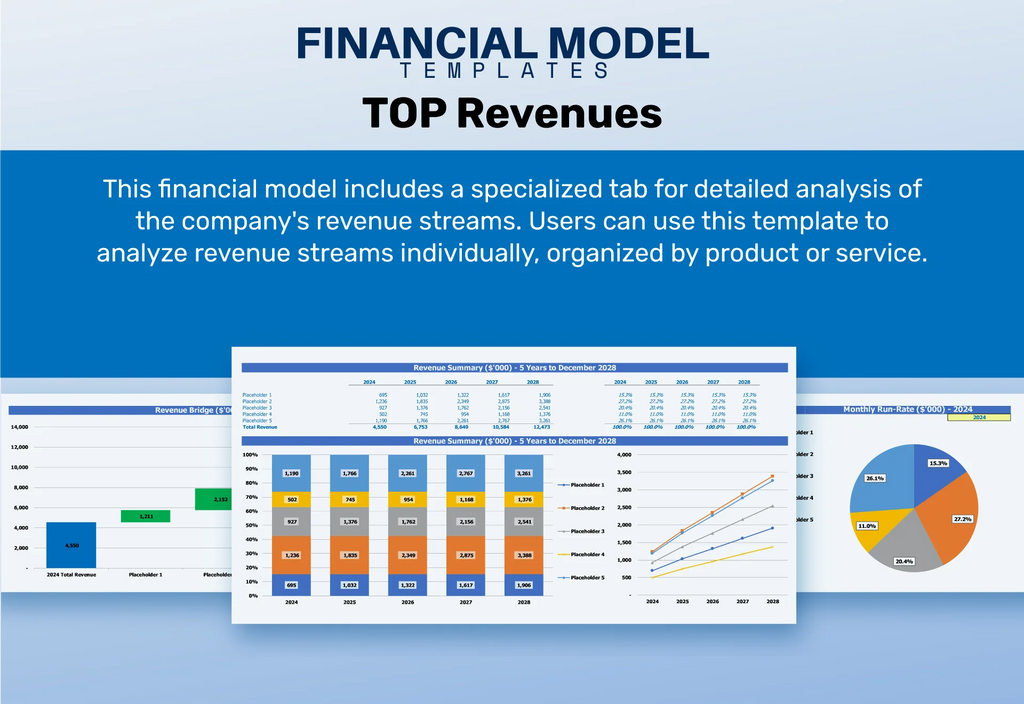
Top Revenue
This pro forma income statement template offers a comprehensive analysis of the natural stone industry, focusing on diverse revenue streams from stone products and services. By detailing pricing models and sales strategies, it enhances financial forecasting for stone businesses. Users can evaluate the cost structure of natural stone production and operational costs from stone quarries, aiding in breakeven analysis and capital investment decisions. This tool also supports cash flow management and identifies market trends, empowering stakeholders to make informed decisions while navigating investment risks and sustainability practices within the stone manufacturing sector.
Business Top Expenses Spreadsheet
To maximize profitability in the natural stone industry, a thorough analysis of the cost structure of stone production is essential. Utilizing our startup pro forma template, you can easily identify and summarize your top operational costs, facilitating strategic planning to optimize spending. By focusing on these key expenses, both startups and established businesses can implement effective sales strategies and enhance financial health indicators. Regular monitoring and adjustment of financial projections will ensure sustainable profitability, while attention to supply chain management and investment risks will safeguard against market fluctuations.

NATURAL STONE MANUFACTURING FINANCIAL PROJECTION EXPENSES
Costs
Our pro forma Excel template empowers businesses in the natural stone industry to strategically plan for the future. It enables the preparation of financial projections and expense budgets for up to five years, revealing cost trends through key metrics like income percentages and operational expenses. Costs are meticulously categorized into variable, fixed expenses, and CAPEX, facilitating in-depth analysis of the cost structure and capital investment requirements. This tool enhances cash flow management, supports breakeven analysis, and provides insights into profit margins, ultimately driving informed decision-making for sustainable growth in stone manufacturing.

CAPEX Spending
The startup budget provides a comprehensive overview of financial resources dedicated to enhancing competitiveness in the natural stone industry. By focusing on capital investment and operational costs—excluding staff salaries—it highlights areas for strategic investment. Understanding the cost structure of natural stone production is vital for pinpointing opportunities for growth and efficiency. As capital expenditures vary across business models, this analysis is crucial for aligning financial projections and sales strategies, ensuring sustainable profitability in a fluctuating market. Such insights facilitate informed decision-making and risk management for stone producers.

Loan Financing Calculator
Effective management of loan profiles, repayment schedules, and utilization of funds is crucial, especially for startups in the natural stone industry. Implementing robust infrastructure and software enables detailed tracking of outstanding amounts, maturity dates, and maintenance ratios. A well-structured loan repayment schedule outlines interest expenses and principal milestones, directly influencing cash flow projections. These financial metrics should seamlessly integrate with the balance sheet, highlighting the impact of regular loan repayments on cash flow. This clarity aids stone producers in navigating investment risks and optimizing their financial health for sustainable growth in the competitive stone manufacturing sector.

NATURAL STONE MANUFACTURING EXCEL FINANCIAL MODEL METRICS
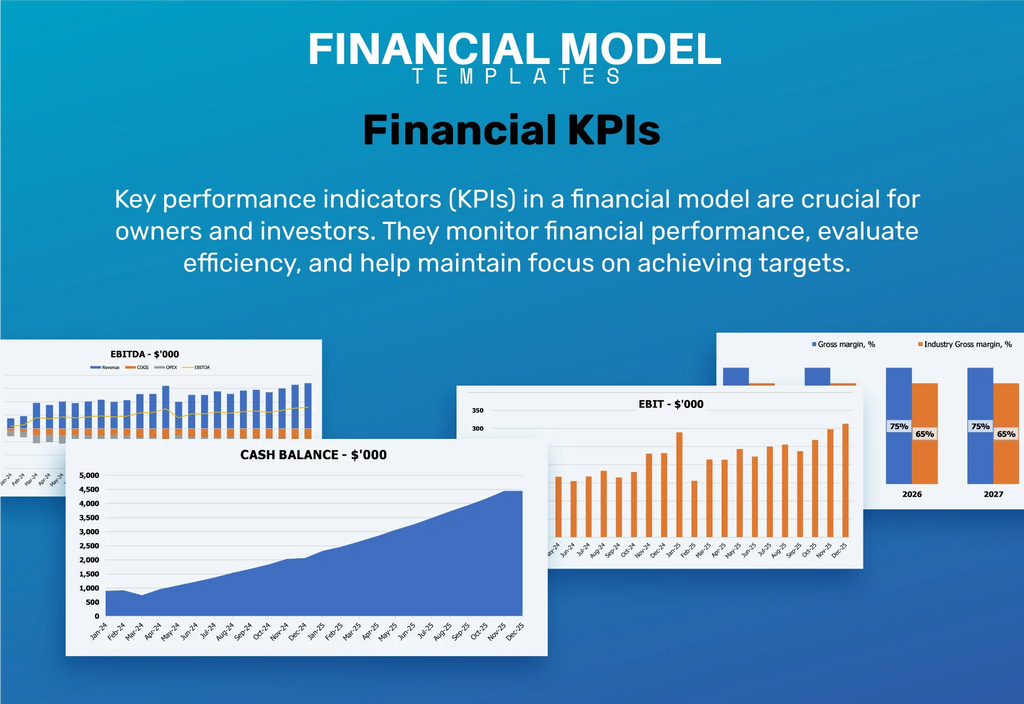
Financial KPIs
Return on assets (ROA) is a critical financial metric that assesses a stone company's efficiency in generating profits from its assets. It can be calculated using projected balance sheets and income statements. By analyzing ROA, stakeholders can evaluate earnings relative to the capital invested in stone manufacturing. Understanding this ratio is essential for navigating investment risks, enhancing production efficiency, and implementing effective sales strategies. As market trends evolve, a strong ROA can indicate financial health, guiding capital investment decisions and cash flow management within the competitive natural stone industry.
Cash Flow Forecast Excel
A robust cash flow projections template is essential for startups in the natural stone industry, as it demonstrates the financial health indicators critical for attracting investment. This template enables businesses to analyze their revenue model, operational costs, and breakeven analysis, providing insights into market trends and pricing models. With accurate financial forecasting for stone producers, companies can effectively manage their cash flow, assess investment risks, and identify opportunities for growth in export markets. By understanding these dynamics, stone enterprises can enhance their production efficiency and implement sustainable practices, ultimately driving profitability in a competitive landscape.

KPI Benchmarks
For an effective benchmarking study, our startup financial model excels with a dedicated benchmark tab focused on the natural stone industry. This analysis evaluates a company's performance against peers, leveraging key metrics such as production efficiency, operational costs, and profit margins. By employing robust financial forecasting, businesses can identify sales strategies and capital investment opportunities, while also considering market trends and regulatory considerations. Ultimately, this comprehensive approach enhances insights into financial health indicators and cash flow management, enabling informed decisions that drive success in the competitive stone manufacturing landscape.

P&L Statement Excel
The profit and loss statement template in Excel integrates non-cash transactions into its expenses, such as asset depreciation, reflecting the true cost of utilizing resources for revenue generation. In contrast to the cash flow projection template that focuses solely on actual cash movements, the profit and loss statement provides a comprehensive view of financial health. This inclusion is vital for stone businesses as it aids in financial projections, breakeven analysis, and monitoring profit margins, ensuring informed decision-making amidst market trends and investment risks in the natural stone industry.

Pro Forma Balance Sheet Template Excel
The projected balance sheet serves as a crucial financial tool for stakeholders in the natural stone industry. It outlines the company’s assets and liabilities, providing insight into capital investment and the overall financial health of the stone manufacturing revenue model. This template highlights the investment risks and cash flow management strategies essential for sustainable operations. By analyzing properties and obligations, stakeholders can better understand breakeven analysis and profitability, while also considering market trends and pricing models for natural stone products. Ultimately, it assists in crafting informed financial projections for stone businesses.

NATURAL STONE MANUFACTURING FINANCIAL PROJECTION TEMPLATE VALUATION
Startup Valuation Model
The startup company valuation spreadsheet intricately outlines vital financial metrics, including the Weighted Average Cost of Capital (WACC), Discounted Cash Flows (DCF), and Free Cash Flows (FCF). WACC offers a comprehensive view of capital costs, balancing equity and debt, and serves as a key risk assessment metric for lenders. Meanwhile, the DCF calculation provides insight into the present value of future cash flows, making it crucial for evaluating investment opportunities in the natural stone industry. These elements facilitate informed decision-making, supporting strategic planning and financial forecasting for stone producers.

Cap Table
In the natural stone industry, a well-structured capitalization table is crucial for assessing shareholder ownership dilution across multiple funding rounds. This tool enables stone manufacturers to conduct financial forecasting, ultimately enhancing their revenue models. By analyzing operational costs, including stone quarry expenses and capital investments, businesses can identify profit margins and assess investment risks. Additionally, effective cash flow management and strategic pricing models contribute to improved financial health. Embracing market trends and sustainability practices can further position stone enterprises for lucrative export opportunities and strong performance within the evolving landscape.

KEY FEATURES
A robust financial model enhances profit margins and streamlines cash flow management for businesses in the natural stone industry.
A robust financial model streamlines cash flow management, freeing up time for product innovation and customer engagement in the stone industry.
Our financial model enhances profitability and optimizes cost structure, driving strategic decision-making in the natural stone industry.
Leverage our financial model to streamline your natural stone industry analysis and enhance profitability without the complexities of traditional methods.
Effective financial forecasting for stone producers enhances budgeting, enabling better cash flow management and strategic investment decisions.
A robust financial model empowers stone businesses to accurately forecast cash flow, optimize operations, and strategically navigate market trends.
Implementing a robust financial model enhances profitability and reduces investment risks for stakeholders in the natural stone industry.
A robust financial model enhances decision-making in the natural stone industry, improving profitability and investment efficiency.
Implementing a robust financial model enhances stakeholder trust by providing transparency in projections and strategic planning for stone businesses.
A strong financial model enhances stakeholder confidence, facilitating investment in the natural stone industry's growth and operational efficiency.
ADVANTAGES
A comprehensive financial model streamlines assumptions, enhancing decision-making and forecasting accuracy for natural stone businesses.
Implementing a robust financial model enhances profitability and mitigates investment risks in the natural stone industry.
A robust financial model enhances decision-making, ensuring optimal capital investment and improved profit margins in the natural stone industry.
The financial modeling template empowers stone businesses to anticipate challenges, optimize cash flow, and enhance profitability in the industry.
An Excel financial model enhances decision-making by analyzing stone manufacturing revenue, profit margins, and cash flow management effectively.