


High Performance E Bike Sales Financial Model

- ✔ 5-Year Financial Projections
- ✔ 100% Editable
- ✔ Investor-Approved Valuation Models
- ✔ MAC/PC Compatible, Fully Unlocked
- ✔ No Accounting Or Financial Knowledge
High Performance E Bike Sales Financial Model
Bundle Includes:


ALL IN ONE MEGA PACK - CONSIST OF:
high performance e bike sales Financial Model/Business Plan Excel Template
Pitch Deck Template For PowerPoint, Keynote & Google Slides
Business Plan Guide and Business Plan Template in MS Word Format
Financial Dashboard in Excel To Track Your Business Performance
HIGH PERFORMANCE E BIKE SALES FINANCIAL MODEL FOR STARTUP INFO
Highlights
This five-year financial model is designed for early-stage startups in the high performance e bike sales sector, focusing on key elements like e bike financial projections, pricing strategy, and operational expenses to impress investors and secure capital. By providing a comprehensive analysis of the electric bicycle sales model, it evaluates the cost structure and profit margins in e bike sales while offering insights into high performance electric bike demand and customer acquisition costs. Furthermore, it includes e bike revenue forecasts and profitability analysis to assist in financial planning, all aimed at ensuring a robust ROI on e bike sales and a clear understanding of market trends and target audience dynamics.
This comprehensive high-performance e-bike financial model addresses key pain points by providing detailed e-bike revenue forecasts and profitability analyses tailored to the electric bicycle sales model, allowing users to effectively anticipate high-performance e-bike demand and optimize profit margins. By employing a data-driven approach to financial planning for e-bike sales, the model simplifies the assessment of customer acquisition costs and operational expenses while facilitating a thorough e-bike market trends analysis. The pricing strategy embedded within the template aids in creating a competitive edge, ensuring that users can effectively navigate the cost structure of e-bike sales and conduct insightful performance e-bike market analyses. With built-in metrics for evaluating ROI on e-bike sales, this template supports strategic decision-making for high-performance e-bike investments, ultimately driving sustained sales growth and enhancing overall financial health.
Description
Our financial model for high performance e bike sales offers a comprehensive analysis that caters to operational management, investors, and detailed financial analysis. Designed to facilitate informed business and financial decision-making, the template incorporates key aspects such as e bike pricing strategy, revenue forecasts, and profitability analysis for electric bikes. By creating a structured approach to financial planning, this model aids in outlining necessary capital investments and working capital needs, ultimately enhancing projections for monthly sales growth and operational expenses. Additionally, the high performance e bike sales Excel template generates a 60-month financial outlook, including cash flow statements, projected profit and loss, and balance sheets, while calculating essential metrics like ROI on e bike sales, break-even points, and customer acquisition costs for e bikes, ensuring a thorough understanding of market dynamics and potential profit margins in e bike sales.
HIGH PERFORMANCE E BIKE SALES FINANCIAL MODEL REPORTS
All in One Place
Our high-performance e-bike sales pro forma template offers a comprehensive financial forecast, integrating key elements from your foundational financial reporting, including profit and loss, projected balance sheets, and cash flow statements. Unlike simplified models that rely on a single financial statement, our template enables robust scenario planning and profitability analysis. This approach empowers you to assess the impact of strategic changes on e-bike revenue forecasts, pricing strategies, and operational expenses. By leveraging this tool, you can enhance financial planning, improve ROI on e-bike sales, and identify customer acquisition costs effectively.

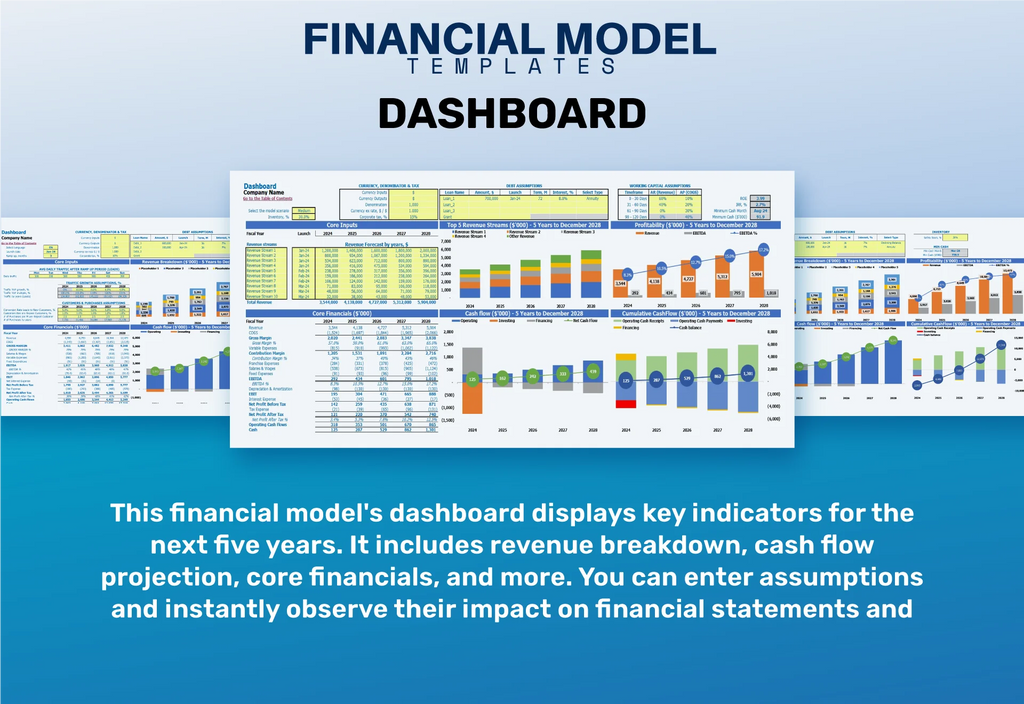
Dashboard
This startup financial model template offers a comprehensive overview of essential financial metrics for high-performance e-bike sales. Featuring detailed revenue breakdowns, cash flow projections, and financial forecasts, it equips you with the tools necessary for effective financial planning in the e-bike market. Use this dashboard to analyze electric bicycle sales models, evaluate profit margins, and understand customer acquisition costs. With insights into operational expenses and profitability analysis, you can refine your e-bike pricing strategy and enhance your investment approach, ensuring a strong ROI in the growing high-performance electric bike segment.
Business Financial Statements
Our advanced financial projection tool empowers e-bike entrepreneurs to prepare essential financial statements, calculations, and forecasts with ease. This comprehensive solution facilitates effective communication of business operations to stakeholders through automated metrics, enhancing visibility into profitability analysis and performance. Additionally, the tool crafts professional presentations featuring dynamic financial graphs and charts, streamlining the presentation of electric bicycle sales models to potential investors. With a focus on key financial metrics, it aids in strategic planning for high-performance e-bike sales, ensuring a clear understanding of market trends and revenue forecasts.

Sources And Uses Statement
The Sources and Uses of Capital statement is essential in our startup financial plan, providing stakeholders with a clear overview of funding sources and their allocations. In the high-performance e-bike market, this document is critical for understanding investment strategies, financial projections, and operational costs associated with electric bicycle sales. It also aids in evaluating profit margins, customer acquisition costs, and overall ROI for high-performance e-bike sales. This transparency enhances financial planning, ensuring informed decisions that align with e-bike market trends and sales growth forecasts.

Break Even Point In Sales Dollars
The break-even calculation tab in this comprehensive financial model highlights critical profitability insights for your high-performance e-bike venture. By visually representing when your revenues surpass operational expenses, the graph serves as a key indicator of financial health. Understanding this point is crucial for evaluating your e-bike sales strategy, optimizing your pricing model, and forecasting revenue growth. It also aids in determining customer acquisition costs and analyzing profit margins, ensuring informed decision-making for sustained investment in the growing electric bicycle market.

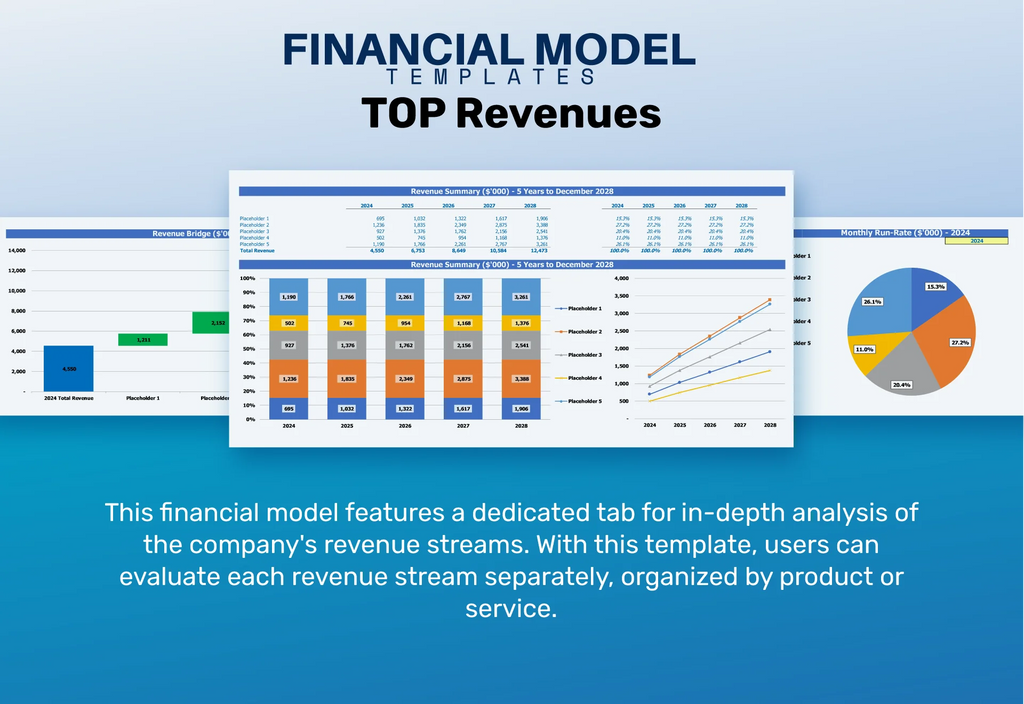
Top Revenue
In the high-performance e-bike market, understanding both top-line and bottom-line metrics is crucial for effective financial planning. The top line represents total revenues from e-bike sales, reflecting market demand and growth potential. Conversely, the bottom line indicates net income, showcasing profitability after operational expenses are accounted for. By analyzing electric bicycle sales models and e-bike pricing strategies, companies can enhance profit margins and optimize customer acquisition costs. Robust e-bike financial projections and revenue forecasts enable businesses to set clear targets while adapting to market trends, ensuring sustained growth and strong ROI in this dynamic sector.
Business Top Expenses Spreadsheet
Our financial model XLS enhances expense analysis through a well-organized interface. In the comprehensive three-statement model, expenses are categorized into four distinct segments, plus an 'other' category for customized data input. This structure supports effective financial planning for e bike sales, enabling a clear view of operational expenses and their impact on profit margins. By leveraging these insights, businesses can refine their e bike sales strategy, optimize customer acquisition costs, and improve ROI. Stay ahead in the high performance electric bike market with strategic financial metrics that drive profitability and growth.

HIGH PERFORMANCE E BIKE SALES FINANCIAL PROJECTION EXPENSES
Costs
Unlock the potential of your high-performance e-bike sales with our essential financial model. This powerful tool enables you to analyze costs, risks, and key financial metrics, ensuring a robust understanding of your e-bike revenue forecast. Our user-friendly financial projections template streamlines your financial planning, highlighting critical areas needing attention, from operational expenses to customer acquisition costs. Gain insights into your e-bike pricing strategy and performance trends, paving the way for strategic investments and improved profit margins. Enhance your e-bike sales strategy and stay ahead in the booming electric bicycle market.

CAPEX Spending
This comprehensive three-way financial model template features a CapEx calculation with built-in formulas, allowing users to assess the capital expenditures essential for launching a high-performance e-bike sales strategy. By utilizing forecasted income statements and projected balance sheets, startups can effectively evaluate their e-bike financial projections. This template streamlines financial planning for e-bike sales, enabling businesses to analyze their cost structure, profitability, and ROI. It serves as a crucial tool for navigating the electric bicycle sales model and optimizing performance metrics in a rapidly growing market and high-performance electric bike demand.

Loan Financing Calculator
Start-ups and emerging businesses must effectively manage their loan repayment schedules, detailing amounts, maturity terms, and other vital aspects. Integrating this plan into cash flow analysis is crucial, as interest payments directly impact financial projections. A thorough understanding of the cost structure and operational expenses related to e bike sales enhances financial planning. Additionally, incorporating e bike sales channel analysis and customer acquisition costs can optimize ROI. By aligning high performance e bike market analysis with financial metrics, businesses can forecast e bike revenue and strategically position themselves for sustained growth in a competitive market.

HIGH PERFORMANCE E BIKE SALES EXCEL FINANCIAL MODEL METRICS
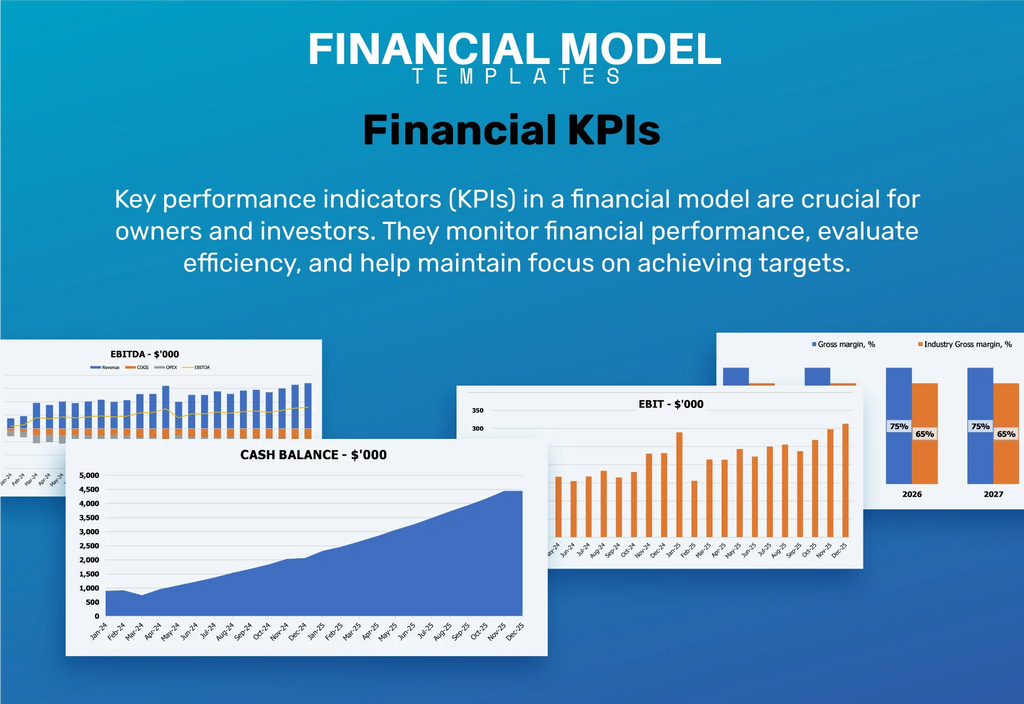
Financial KPIs
EBITDA serves as a vital metric for assessing the financial health of high-performance e-bike sales. By utilizing a projected cash flow statement, businesses can evaluate their operational efficiency and profitability. A robust e-bike financial planning strategy, paired with comprehensive market analysis, helps in identifying high-performance electric bike demand and optimizing profit margins. Understanding customer acquisition costs and e-bike sales channels is essential for an effective sales model. With accurate revenue forecasts and performance metrics, companies can strategically invest and enhance their e-bike pricing strategy, ensuring sustainable growth in this dynamic market.
Cash Flow Forecast Excel
An effective cash flow projection is crucial for a high-performance e-bike sales strategy. Utilizing a well-structured financial planning tool allows you to manage operational expenses while forecasting revenue from high-performance electric bike demand. By analyzing financial metrics and customer acquisition costs, you can optimize your pricing strategy and enhance profit margins. A comprehensive approach to e-bike financial projections will provide valuable insights into market trends, ensuring a solid ROI on your investment and guiding strategic decisions for sustainable growth and profitability in the dynamic electric bicycle market.

KPI Benchmarks
Conducting a benchmarking analysis using our pro forma income statement template enhances your e-bike sales strategy. By comparing key financial metrics against industry peers, you can evaluate your electric bicycle sales model and operational efficiency. This analysis reveals insights into profit margins, customer acquisition costs, and overall performance within the high-performance e-bike market. Understanding e-bike market trends and financial projections is crucial for effective financial planning and maximizing ROI. Utilize this template to refine your pricing strategy, forecast revenue, and identify areas for improvement, ensuring your company remains competitive in the growing e-bike sector.

P&L Statement Excel
To secure the future profitability of high-performance e-bike sales, employing a robust financial planning strategy is essential. Utilizing a profit and loss projection template allows for accurate forecasting, helping to predict potential profits and losses based on historical data. Additionally, our financial projections model generates annual reports that inform strategic decisions, particularly beneficial for startups and growing businesses. By focusing on key metrics like customer acquisition costs, pricing strategy, and profit margins, companies can enhance their e-bike sales model and drive sustainable growth in the competitive electric bicycle market.

Pro Forma Balance Sheet Template Excel
The balance sheet forecast is crucial for assessing a company's financial health, displaying assets and liabilities. In contrast, a profit and loss statement highlights operational results over time, offering insights into e bike revenue forecasts and profitability analysis. Pro forma balance sheets are essential for startups, showcasing equity distinctions and financial planning for e bike sales. Additionally, projected balance sheets reveal key metrics like turnover and liquidity ratios, vital for evaluating the effectiveness of your e bike sales strategy. Understanding these financial metrics is imperative for navigating high-performance electric bike market trends and ensuring robust profit margins.

HIGH PERFORMANCE E BIKE SALES FINANCIAL PROJECTION TEMPLATE VALUATION
Startup Valuation Model
Our startup valuation template offers a comprehensive approach to evaluating financial metrics crucial for e bike sales strategy. By calculating the Weighted Average Cost of Capital (WACC), we effectively analyze the equity and debt structure, critical for assessing high-performance electric bike investments. The Discounted Cash Flows (DCF) analysis enables us to project future cash flows, providing insights into electric bicycle sales models and profitability analysis. These tools are essential for financial planning, enhancing accuracy in e bike revenue forecasts and understanding market trends, ultimately optimizing ROI on e bike sales.

Cap Table
A cap table is a crucial financial tool for startups, particularly in the high-performance e-bike sector. It outlines equity distribution, including shares, options, and convertible bonds, across funding rounds. This clarity helps in financial planning for e-bike sales, anticipating ownership stakes, and understanding potential dilution. By incorporating projections like e-bike financial metrics and ROI, startups can effectively strategize e-bike pricing and customer acquisition costs. Monitoring the cap table enables insightful analysis of profit margins and operational expenses, ensuring sustainability and growth within the rapidly evolving electric bicycle market.

KEY FEATURES
A robust financial model for high-performance e-bike sales enhances investor confidence and projects sustainable profitability in a growing market.
Utilizing a comprehensive e bike financial model will enhance investor engagement and highlight the strong growth potential in the market.
Develop a robust financial model for your e bike sales strategy to optimize profit margins and forecast revenue growth effectively.
This powerful financial model empowers high performance e bike sales strategies, ensuring informed decisions for maximizing profitability and growth.
A robust financial model for e bike sales enhances profitability analysis and optimizes revenue forecasts to align with market trends.
Refining your high performance e bike sales strategy enables agile financial planning, optimizing profitability and enhancing growth opportunities throughout your business.
A robust financial model enhances decision-making by providing insights into e bike pricing strategy and revenue forecasts for high performance models.
Enhance your e bike sales strategy by leveraging comprehensive financial projections to confidently navigate operational decisions and maximize profitability.
A robust financial model optimizes e bike sales strategy, enhancing ROI while saving time and money through informed decision-making.
Utilizing our financial model empowers e bike sales strategies, enhancing profitability analysis and optimizing your investment in high performance electric bikes.
ADVANTAGES
A solid financial model enhances e bike sales strategy by predicting cash flows, helping identify gaps and seizing opportunities efficiently.
Utilizing the high performance e bike sales financial model enables precise forecasting and strategic planning for maximizing profitability and growth.
A robust financial model enables precise revenue forecasts and enhances profitability analysis for high performance e bike sales strategies.
The 5-Year Financial Projection Template for e bikes simplifies assumptions, enhancing accuracy in sales strategy and revenue forecasts.
Easily forecast cash levels and enhance profitability with a robust financial model for high performance e bike sales.