Energy Bar Manufacturing Financial Model

- ✔ 5-Year Financial Projections
- ✔ 100% Editable
- ✔ Investor-Approved Valuation Models
- ✔ MAC/PC Compatible, Fully Unlocked
- ✔ No Accounting Or Financial Knowledge
Energy Bar Manufacturing Financial Model
Bundle Includes:
ALL IN ONE MEGA PACK - CONSIST OF:
energy bar manufacturing Financial Model/Business Plan Excel Template
Pitch Deck Template For PowerPoint, Keynote & Google Slides
Business Plan Guide and Business Plan Template in MS Word Format
Financial Dashboard in Excel To Track Your Business Performance
ENERGY BAR MANUFACTURING FINANCIAL MODEL FOR STARTUP INFO
Highlights
In developing a robust financial model for energy bar manufacturing startups, it is essential to conduct a comprehensive energy bar market analysis that incorporates production costs, ingredient sourcing, and manufacturing overhead. By optimizing the manufacturing process and enhancing operational efficiency, startups can improve their cost structure and achieve a favorable profit margin. A well-defined energy bar pricing strategy, informed by demand forecasting and a break-even analysis, will help in setting competitive prices across various sales channels. Furthermore, the financial projections should account for necessary capital investment and the scalability of production to meet market demands, while a thorough risk assessment will ensure that potential pitfalls in the supply chain and recipe formulation are effectively managed.
The ready-made financial model excels in addressing common pain points in energy bar production by offering a comprehensive analysis of energy bar pricing strategy, manufacturing overhead, and ingredient sourcing, which streamlines the cost structure of energy bars. It includes detailed demand forecasting and energy bar sales forecasts to improve operational efficiency and provide insights into risk assessment for energy bar production. Additionally, the model facilitates break-even analysis and competitive analysis, allowing users to evaluate profit margins and capital investment needs effectively. With a focus on production scalability and manufacturing process optimization, the Excel template automates financial projections, making it easier for buyers to navigate the complexities of the energy bar market while enhancing their supply chain management and sales channels.
Description
Our energy bar manufacturing financial model template provides a comprehensive framework for analyzing production costs, profit margins, and pricing strategies, essential for optimizing operational efficiency in the energy bar industry. The model's in-depth market analysis includes demand forecasting, competitive analysis, and risk assessment to help you effectively navigate the supply chain and ingredient sourcing while maximizing manufacturing overhead management. With detailed 60-month financial projections, including cash flow statements, profit and loss forecasts, and break-even analysis, this template allows you to evaluate the cost structure and capital investment required for production scalability. Designed for entrepreneurs seeking to penetrate the energy bar market, this user-friendly Excel model simplifies financial reporting and enables informed decision-making for energy bar recipe formulation and sales channel strategies.
ENERGY BAR MANUFACTURING FINANCIAL MODEL REPORTS
All in One Place
Designing a robust financial projection for your energy bar manufacturing business doesn’t require financial expertise. With the right financial tools, you can effectively manage production costs, profit margins, and operational efficiency. Our comprehensive profit and loss projection template equips you with vital insights into the cost structure, ingredient sourcing, and potential sales forecasts. Unlock the potential of your energy bar business with strategic capital investment and break-even analysis, ensuring a well-informed approach to pricing and supply chain management. Optimize your recipe formulation and enhance scalability for a competitive edge in the energy bar market.

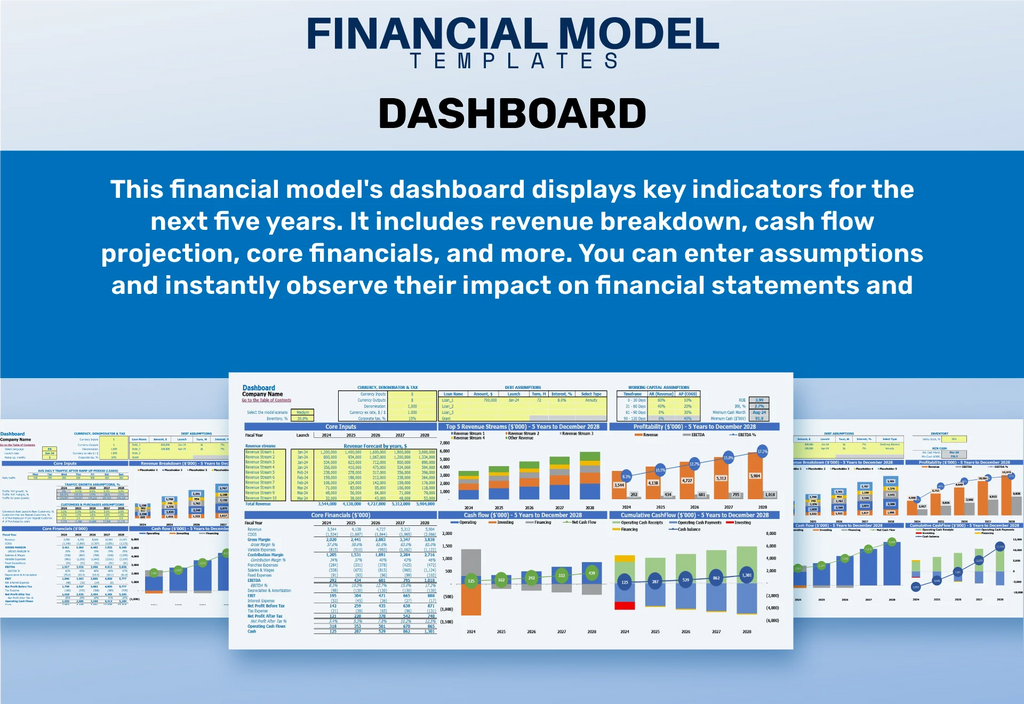
Dashboard
Our financial dashboard streamlines your energy bar production analysis by automatically calculating key metrics such as profit margin, cost structure, and sales forecasts. This tool transforms complex data into intuitive charts and graphs, facilitating clear communication with stakeholders. Users can easily assess revenue projections, conduct break-even analysis, and evaluate manufacturing overhead, all tailored to optimize operational efficiency. With insights into ingredient sourcing and supply chain dynamics, this dashboard empowers investors to make informed decisions about capital investment and production scalability in the competitive energy bar market.

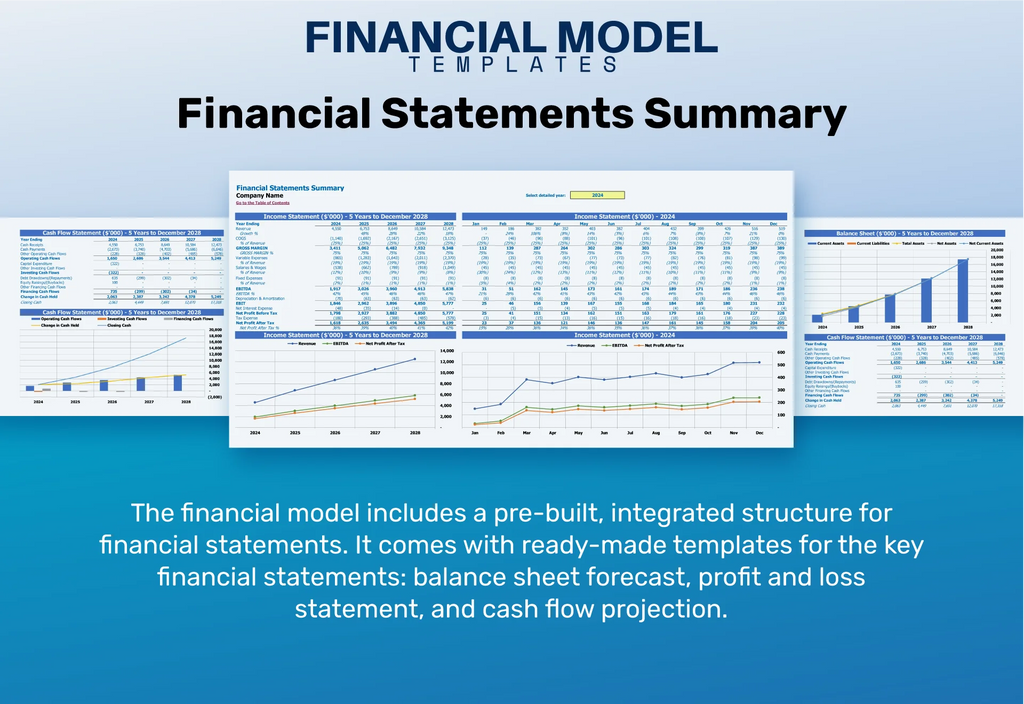
Business Financial Statements
Understanding the three core financial statements is crucial for owners and stakeholders in the energy bar industry. Each report offers key metrics to assess financial health. The pro forma income statement reveals vital insights into the operational efficiency and profit margins of energy bar production. In contrast, the pro forma balance sheet and five-year cash flow projections emphasize capital investment and cost structure, essential for ingredient sourcing and risk assessment. Together, these tools provide a comprehensive financial analysis, guiding effective pricing strategies and enhancing production scalability in a competitive market.

Sources And Uses Statement
This financial projection Excel template offers a comprehensive overview of cash flow sources and their distribution within your energy bar business. By facilitating structured business planning and management, it enhances operational efficiency and supports effective decision-making. The template simplifies reporting by meticulously analyzing and calculating all income sources, allowing for accurate demand forecasting and break-even analysis. Its robust framework serves as a reliable tool for assessing capital investment needs and optimizing the cost structure, ensuring you remain competitive in the dynamic energy bar market.

Break Even Point In Sales Dollars
Our financial model template features a comprehensive pro forma for break-even analysis, essential for determining an effective pricing strategy. By leveraging this tool, energy bar businesses can identify the optimal price point that covers production costs, including ingredient sourcing and manufacturing overhead. This analysis not only aids in understanding the cost structure but also enhances operational efficiency and supports demand forecasting. With accurate financial projections, companies can confidently navigate the energy bar market, ensuring competitive advantage and scalable production while maximizing profit margins.

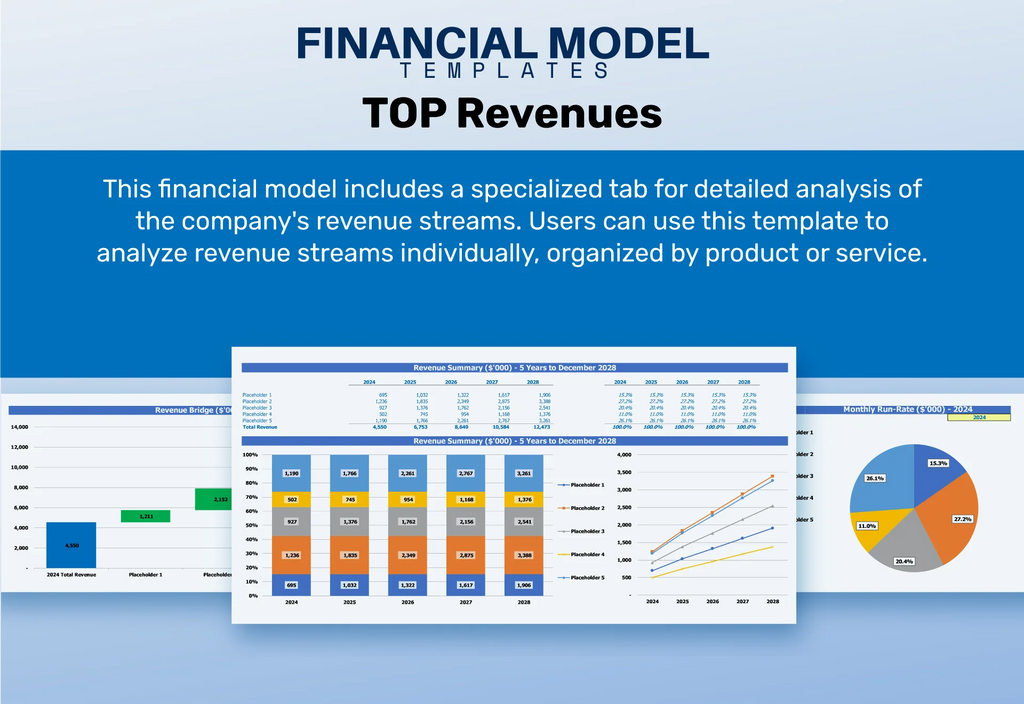
Top Revenue
To optimize your energy bar business, utilize a comprehensive demand report under the Top Revenue column. This analysis will reveal the profitability of various pricing strategies and assess potential production scalability. By examining revenue depth and revenue bridges in a five-year projection, you can forecast demand across periods, enhancing operational efficiency and resource allocation. Incorporating insights from competitive analysis and manufacturing process optimization will inform ingredient sourcing and break-even analysis, ultimately guiding your energy bar production costs and profit margins for sustainable growth. A solid foundation in financial projections will ensure a strategic approach to energy bar sales channels.

Business Top Expenses Spreadsheet
In the Top Expenses section of our business revenue model template, you can meticulously categorize and track significant expenses, including ingredient sourcing, manufacturing overhead, and operational efficiency of energy bars. The five-year financial projections template features an 'other' category for flexibility, allowing you to adapt it to your specific needs. Whether reflecting on historical data or crafting a pro forma plan, this template enables a comprehensive analysis of your energy bar production costs, profit margins, and sales forecasts, ensuring strategic insights for optimal pricing strategies and risk assessments.

ENERGY BAR MANUFACTURING FINANCIAL PROJECTION EXPENSES
Costs
For any energy bar business, a robust financial projection Excel template is essential for managing production costs and optimizing profit margins. This tool aids in crafting an effective energy bar pricing strategy and provides clarity on the overall cost structure. By enabling detailed demand forecasting and break-even analysis, it ensures operational efficiency while addressing ingredient sourcing and manufacturing overhead. Moreover, it enhances communication with investors and streamlines loan applications, ultimately laying the groundwork for sustainable growth and scalable production in a competitive market.

CAPEX Spending
Capital investment in energy bar production encompasses significant start-up expenses related to optimizing technology and equipment. These expenditures are crucial for enhancing operational efficiency and should be meticulously documented in financial projections and projected balance sheets. Notably, a sound energy bar pricing strategy relies on a comprehensive cost structure, including manufacturing overhead and ingredient sourcing. By conducting a break-even analysis and demand forecasting, businesses can gauge profitability and scalability, ensuring a robust foundation for navigating the competitive landscape and optimizing production processes for maximum profit margins.

Loan Financing Calculator
Effectively managing loan profiles, repayment schedules, and their use of proceeds is crucial, particularly for start-ups in the energy bar sector. Establishing robust infrastructure and software is vital, providing detailed insights into outstanding amounts, maturity dates, and maintenance ratios. A well-defined loan repayment schedule should outline interest expenses and principal repayments, influencing cash flow forecasts. This information must seamlessly integrate into financial statements, illustrating how recurring loan obligations impact overall cash flow. Such precision enables energy bar businesses to improve operational efficiency, optimize manufacturing processes, and achieve better capital investment returns while navigating the competitive market landscape.

ENERGY BAR MANUFACTURING EXCEL FINANCIAL MODEL METRICS
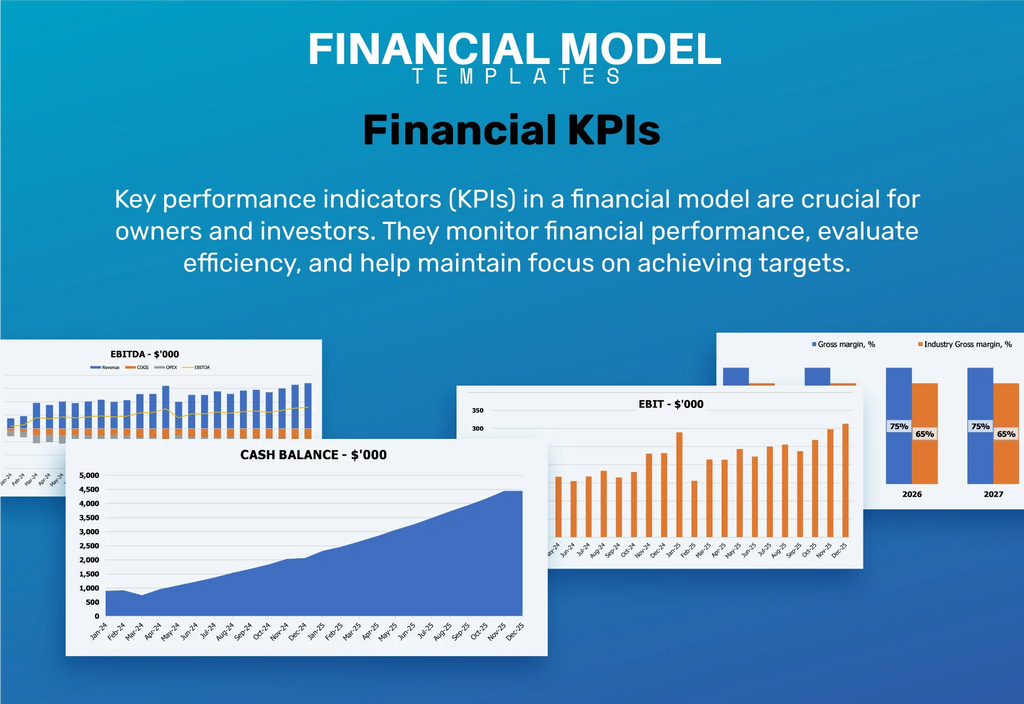
Financial KPIs
Return on capital reflects the earnings generated from your invested capital. In energy bar production, this metric is crucial for assessing the effectiveness of your capital investment and operational efficiency. By analyzing the cost structure, including manufacturing overhead and ingredient sourcing, you can optimize the manufacturing process and improve profit margins. A robust financial model, encompassing break-even analysis and demand forecasting, allows for accurate energy bar market analysis and pricing strategies. Ultimately, sound financial management ensures a healthy return on capital, driving growth and scalability in the energy bar business.

Cash Flow Forecast Excel
A cash flow forecast is essential for a small energy bar business, enabling effective financial management and resource allocation. By analyzing production costs, ingredient sourcing, and manufacturing overhead, businesses can optimize their cost structure. This strategic approach supports a robust pricing strategy, enhancing profit margins and operational efficiency. Additionally, demand forecasting and break-even analysis ensure that sales channels align with market trends, while financial projections bolster capital investment decisions. Ultimately, a comprehensive cash flow projection fosters scalability and risk assessment, ensuring sustainable growth in the competitive energy bar market.

KPI Benchmarks
Benchmarking is a vital tool for startups in the energy bar industry, providing insights into key financial metrics such as profit margins and production costs. By analyzing operational efficiency and cost structures against industry standards, companies can optimize their manufacturing processes and ingredient sourcing. This comparative analysis aids in refining pricing strategies, enhancing scalability, and forecasting sales. Ultimately, effective benchmarking drives better decision-making and improves the competitive positioning of energy bar businesses, ensuring they align with best practices and maximize their profit margins in a dynamic market.

P&L Statement Excel
The financial model for the energy bar business streamlines profit and loss reporting, ensuring precision in calculations. It serves as a comprehensive tool for assessing key metrics, including profit margins and production costs. By incorporating elements such as ingredient sourcing and manufacturing overhead, the model provides insights into the cost structure and operational efficiency. Furthermore, it aids in demand forecasting and break-even analysis, showcasing the potential profitability of energy bar production while informing strategic decisions on pricing and sales channels. This robust framework supports informed financial projections and competitive analysis, driving success in the energy bar market.

Pro Forma Balance Sheet Template Excel
A pro forma balance sheet serves as a snapshot of a company’s financial health, detailing total assets, liabilities, and stockholders' equity. When paired with a projected income statement, it offers a comprehensive view of both operational performance and capital structure. This synergy is crucial for assessing the financial viability of an energy bar business, as it informs decisions related to energy bar production costs, profit margins, and pricing strategies. By analyzing these elements alongside demand forecasting and operational efficiency, businesses can optimize their energy bar manufacturing process and enhance overall profitability.

ENERGY BAR MANUFACTURING FINANCIAL PROJECTION TEMPLATE VALUATION
Startup Valuation Model
The startup valuation spreadsheet encompasses key financial metrics, including the Weighted Average Cost of Capital (WACC), Discounted Cash Flows (DCF), and Free Cash Flows (FCF). WACC serves as a critical risk assessment tool, providing insights into capital costs with a thorough breakdown of equity and debt proportions, essential for securing financing. Meanwhile, DCF analysis evaluates future cash flows, crucial for making informed investment decisions. Together, these metrics form the backbone of a solid energy bar production strategy, guiding cost structure optimization and pricing strategies for enhanced profitability in a competitive market.

Cap Table
This energy bar production cap table is a game-changer for your business. It efficiently analyzes profit margins, production costs, and operational efficiency, ensuring you effectively manage ingredient sourcing and overhead. With tools for demand forecasting and competitive analysis, you can strategically optimize your pricing strategy and enhance production scalability. This versatility empowers you to make informed financial projections and conduct thorough risk assessments, paving the way for successful energy bar sales channels and a robust supply chain. Maximize your capital investment with precise metrics that drive your energy bar market analysis forward.

KEY FEATURES
A robust financial model enhances operational efficiency and optimizes energy bar production costs, ensuring your budget remains on track.
Utilizing a cash flow projections model enhances financial planning, ensuring informed decisions on energy bar production costs and profitability.
Our comprehensive financial model enhances operational efficiency, ensuring optimized energy bar production costs and maximizing profit margins for successful investment.
A robust financial model streamlines energy bar pricing strategies, enhancing investor negotiations and accelerating funding for growth.
A robust financial model enhances operational efficiency and informs strategic decisions in energy bar production and pricing.
Our financial model enables seamless creation of a comprehensive 5-year energy bar feasibility study, enhancing clarity in profit margins and costs.
A robust financial model enhances operational efficiency and supports demand forecasting, crucial for attracting external stakeholders like banks.
A robust financial model enhances operational efficiency and supports informed decision-making for energy bar production and profitability.
A robust financial model enhances energy bar profit margins through effective supply chain management and demand forecasting, driving business growth.
Utilizing a cash flow model enables strategic decision-making by highlighting funding options to optimize energy bar production costs and growth.
ADVANTAGES
A bottom-up financial model enhances operational efficiency by optimizing costs and maximizing profit margins in energy bar production.
A robust financial model ensures energy bar startups can effectively manage production costs and optimize profit margins for sustainable growth.
A robust financial model enables precise adjustments in energy bar production costs, enhancing profit margins and operational efficiency.
A robust financial model enhances operational efficiency and informs energy bar pricing strategies for optimal profit margins and scalability.
Reassessing assumptions with a three-way financial model enhances operational efficiency and optimizes pricing strategies for energy bars.


