Bull Riding Financial Model

- ✔ 5-Year Financial Projections
- ✔ 100% Editable
- ✔ Investor-Approved Valuation Models
- ✔ MAC/PC Compatible, Fully Unlocked
- ✔ No Accounting Or Financial Knowledge
Bull Riding Financial Model
Bundle Includes:
ALL IN ONE MEGA PACK - CONSIST OF:
bull riding Financial Model/Business Plan Excel Template
Pitch Deck Template For PowerPoint, Keynote & Google Slides
Business Plan Guide and Business Plan Template in MS Word Format
Financial Dashboard in Excel To Track Your Business Performance
BULL RIDING FINANCIAL MODEL FOR STARTUP INFO
Highlights
The five-year bull riding financial model template excels in providing startups and entrepreneurs with a comprehensive bull riding profitability analysis to impress investors and secure funding. This template includes key financial charts and summaries that address bull riding revenue streams, expense management, and operational costs, while also highlighting bull riding sponsorship opportunities and ticket sales revenue. Designed with an emphasis on bull riding market analysis, financial forecasting, and cash flow projections, it serves as a robust tool for evaluating bull riding investment strategy and risk assessment. By utilizing this model, users can develop a solid bull riding business model, effectively manage cash, and project growth potential, ensuring a clear understanding of profitability margins and the economic impact of bull riding events. Unlock the ability to edit all components to tailor the model to specific needs, facilitating better financial planning and a focused profit and loss statement.
The bull riding Excel financial model addresses critical pain points for buyers by streamlining profitability analysis and enhancing expense management, allowing for a thorough understanding of revenue streams and operational costs. With features that provide in-depth bull riding market analysis and risk assessment, users can make informed decisions regarding their investment strategy while benefiting from accurate financial forecasting and cash flow projections. This template also aids in event budgeting and ticket sales revenue tracking, ensuring that bull riding sponsorship opportunities are maximized, ultimately leading to improved profitability margins and cash management. By developing a robust business model, users can easily generate profit and loss statements while assessing growth potential and financial metrics essential for sustainable operations in the bull riding industry.
Description
The bull riding financial model offers a comprehensive analysis of profitability, featuring input tables and charts that facilitate robust decision-making based on accurate financial data. This bull riding business plan template includes essential components such as a startup summary, a detailed 60-month forecasted income statement, and a projected balance sheet, along with an equity valuation sheet and break-even sales calculations. By focusing on bull riding revenue streams, operational costs, and expense management, the template supports effective financial planning and cash flow projections, while evaluating sponsorship opportunities and growth potential. With an emphasis on financial metrics and risk assessment, the model aids in developing a solid investment strategy and enhances the overall understanding of bull riding's economic impact and profitability margins.
BULL RIDING FINANCIAL MODEL REPORTS
All in One Place
Our bull riding financial projection template encompasses vital financial reports for startups and established businesses. It features proformas for profit and loss, cash flow statements, and projected balance sheets, ensuring comprehensive expense management and revenue analysis. Additionally, it includes performance review reports and detailed monthly and annual summaries, facilitating effective financial planning and operational oversight. This resource is essential for assessing profitability margins, evaluating market opportunities, and developing a robust investment strategy that maximizes growth potential and enhances cash flow projections in the bull riding industry.

Dashboard
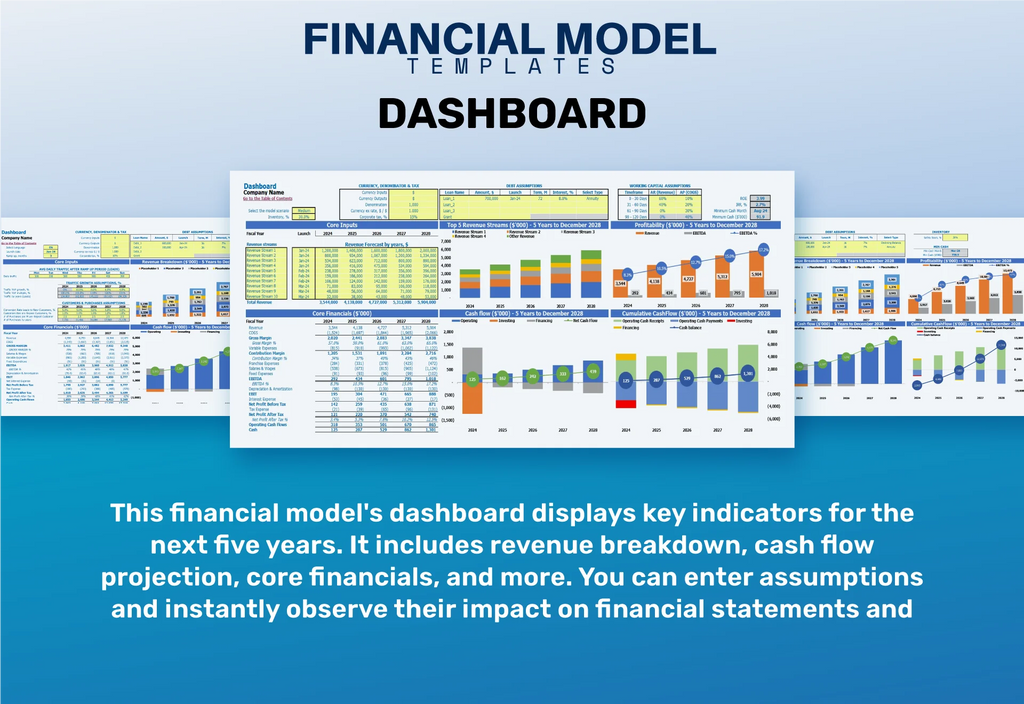
Our five-year cash flow projection template features a comprehensive information panel that highlights key financial metrics for bull riding ventures. This interactive dashboard provides insights into cash flow forecasts, annual revenue streams, profit margins, and overall fund management. By leveraging this analysis, stakeholders can assess the bull riding profitability landscape, evaluate operational costs, and identify growth potential. With precise financial forecasting, businesses can navigate investment strategies and optimize expense management, ensuring a robust bull riding business model that maximizes profitability and sponsorship opportunities.

Business Financial Statements
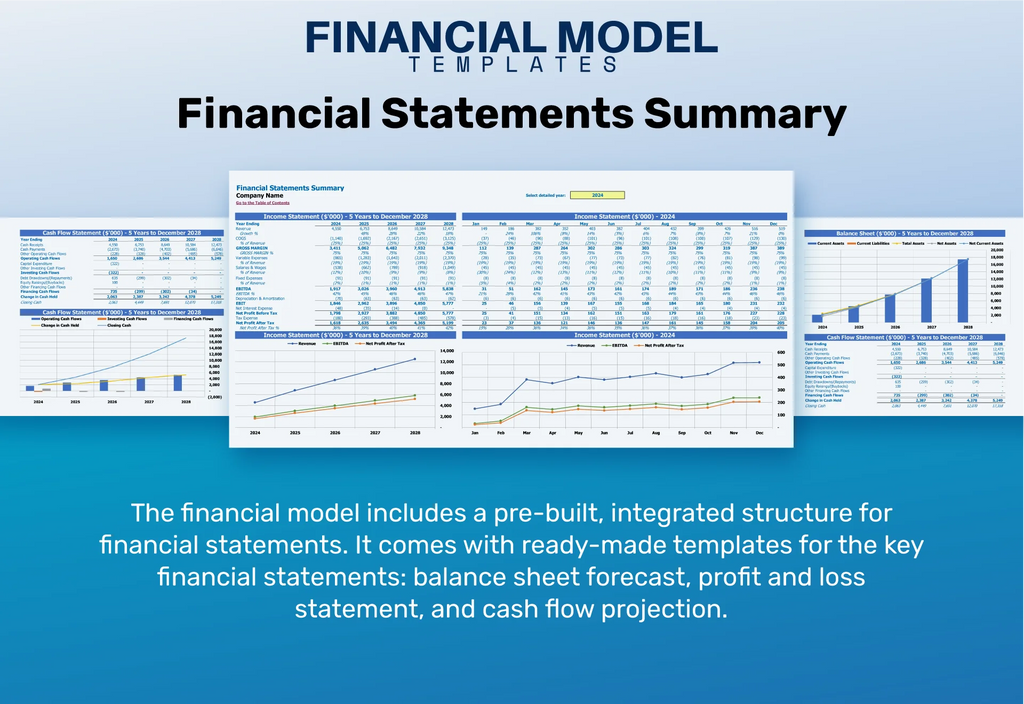
The financial report comprises three key statements essential for bull riding profitability analysis. The Income Statement outlines revenue streams, operational costs, and profit and loss figures. The Balance Sheet details assets and liabilities, ensuring balance for financial stability. Finally, the Cash Flow Statement provides insights into cash management, highlighting inflows and outflows that reflect the organization's cash health. Together, these statements support effective financial forecasting, event budgeting, and investment strategy, facilitating sound decision-making to maximize profitability margins and capitalize on sponsorship opportunities within the bull riding industry.

Sources And Uses Statement
A comprehensive bull riding profitability analysis is essential for evaluating financial performance and growth potential in the industry. By leveraging financial forecasting and expense management tools, investors can assess revenue streams, including ticket sales and sponsorship opportunities, while conductinga market analysis to determine operational costs. Regular cash flow projections and risk assessments ensure informed decision-making. With effective event budgeting and financial planning, bull riding ventures can optimize profit margins and confidently navigate their business models. This data-driven approach enables stakeholders to track performance and project future success, instilling confidence in potential investors.

Break Even Point In Sales Dollars
This break-even analysis report provides essential insights into annual revenue requirements for bull riding operations to achieve profitability. By evaluating total variable and fixed costs, this financial tool enables precise planning for ticket sales revenue and operational costs. Additionally, it can be adapted to project the time frame required to reach the break-even point. Incorporating this analysis into your bull riding investment strategy enhances financial forecasting and risk assessment, ensuring robust cash flow projections and informed decision-making for sponsorship opportunities and event budgeting.

Top Revenue
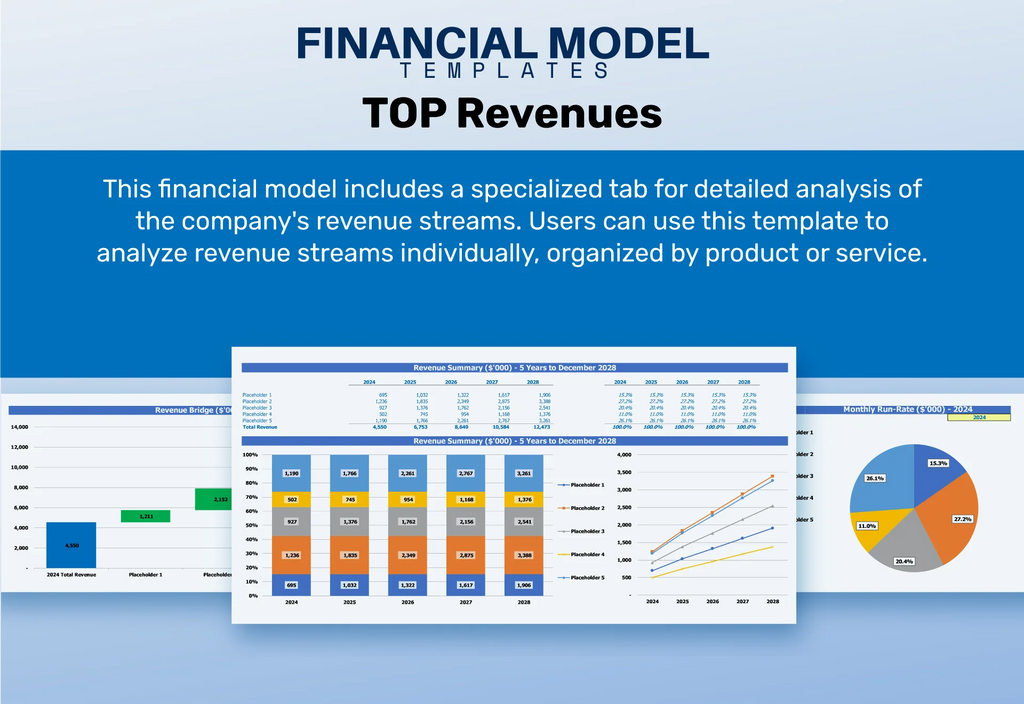
In bull riding, a robust profit and loss statement is vital for assessing financial health. The top line, representing ticket sales revenue and other revenue streams, indicates gross sales growth. This growth signals to investors and analysts a firm’s market potential and overall performance. Continuous monitoring of these financial metrics helps in effective operational costs and expense management. By incorporating comprehensive financial forecasting, cash flow projections, and a solid investment strategy, stakeholders can navigate risks and enhance profitability margins, ensuring a sustainable business model that capitalizes on lucrative sponsorship opportunities and maximizes the economic impact of events.

Business Top Expenses Spreadsheet
In bull riding, both top-line and bottom-line metrics are critical for evaluating financial performance. The top line, representing total revenue streams such as ticket sales and sponsorship opportunities, is essential for gauging growth potential. Increasing top-line revenues often enhance profitability margins and support strategic investments. Conversely, the bottom line reflects net income, highlighting effective expense management and operational costs. Financial forecasting and cash flow projections are vital for assessing risk and ensuring sustainability. A thorough bull riding profitability analysis, incorporating market analysis and event budgeting, can drive robust financial planning and business model development.

BULL RIDING FINANCIAL PROJECTION EXPENSES
Costs
A bull riding financial projection Excel template is essential for effective expense management and revenue stream analysis. This tool organizes operational costs and forecasts cash flow projections, allowing bull riding organizations to identify areas for improvement. By clearly outlining expenses, the template supports strategic financial planning and enhances communication with potential investors and lenders. It aids in developing a robust business model, assessing profitability margins, and exploring sponsorship opportunities, ultimately driving growth potential and ensuring a solid profit and loss statement. Embrace this resource to optimize financial metrics and maximize your bull riding venture’s economic impact.

CAPEX Spending
Bull riding capital expenditures (CapEx) encompass significant investments for asset acquisition, essential for operational optimization. These large expenses, crucial for business model development, should be accurately reflected in the pro forma balance sheet and profit and loss statement. Such investments enhance technology and equipment quality, directly impacting bull riding profitability analysis and cash flow projections. Effective expense management is vital to ensure a positive economic impact and maintain profitability margins. By evaluating risk assessment and financial forecasting, stakeholders can identify growth potential and capitalize on diverse revenue streams, including sponsorship opportunities and ticket sales revenue.

Loan Financing Calculator
A comprehensive bull riding financial model template equips stakeholders with essential insights, including periodic cash flow projections for an amortizing loan. This model outlines key information such as loan amount, interest rate, term to maturity, and payment periods. Various amortization methods—straight-line, declining balance, annuity, bullet, balloon, and negative amortization—can be leveraged to optimize bull riding investment strategies. By integrating expense management and revenue streams, this framework enables effective financial planning, ensuring robust profitability margins and informed decision-making. Ultimately, it enhances overall growth potential and risk assessment in the dynamic bull riding industry.

BULL RIDING EXCEL FINANCIAL MODEL METRICS
Financial KPIs
A bull riding financial projection template encompasses vital key performance indicators (KPIs) such as profitability margins, cash flow metrics, and liquidity ratios. It integrates both company-specific KPIs and local industry benchmarks, offering a comprehensive overview. This analysis aids in effective bull riding expense management and highlights revenue streams, including ticket sales and sponsorship opportunities. By utilizing financial forecasting and risk assessment, stakeholders can refine their bull riding investment strategy and strengthen their business model, ultimately enhancing growth potential and driving profitability.

Cash Flow Forecast Excel
Presenting an insightful overview of your annual bull riding financials is essential for effective reporting and pitches. This comprehensive table encapsulates critical metrics, including revenue streams from ticket sales and sponsorship opportunities, alongside operational costs and expense management. By integrating risk assessment and cash flow projections, you can optimize your bull riding investment strategy. Utilize this data to enhance financial forecasting, ensuring robust profit and loss statements and highlighting your profitability margins. This analysis not only demonstrates growth potential but also underscores the economic impact of your bull riding events.

KPI Benchmarks
Our comprehensive financial model Excel template is tailored for bull riding operations, featuring a robust benchmarking study template. This tool enables stakeholders to assess performance against industry standards and identify key players in the bull riding market. By leveraging bull riding profitability analysis and sponsorship opportunities, this template facilitates strategic decision-making. Users can enhance their bull riding investment strategy, optimize cash flow projections, and improve expense management. Focus your efforts on achieving optimal results with our innovative approach to bull riding financial planning and operational efficiency.

P&L Statement Excel
In the bull riding industry, profitability hinges on effective financial planning and management. A well-structured profit and loss statement provides crucial insights into revenue streams, such as ticket sales and sponsorship opportunities, alongside operational costs and expense management. This annual financial forecasting tool features key metrics, including profit margins, net profit percentages, and tax implications. By leveraging this analysis, businesses can enhance their investment strategies, assess risks, and identify growth potential, ensuring a robust approach to navigating the economic landscape of bull riding events.

Pro Forma Balance Sheet Template Excel
Our comprehensive bull riding profitability analysis includes a detailed monthly and yearly projected balance sheet for five years. This Excel format is interlinked with cash flow projections and profit and loss statements, providing a clear view of bull riding revenue streams and operational costs. Our financial planning emphasizes expense management and risk assessment while exploring sponsorship opportunities and ticket sales revenue. With a strong focus on financial forecasting and metrics, this robust business model development enhances growth potential and profitability margins in the competitive bull riding market.

BULL RIDING FINANCIAL PROJECTION TEMPLATE VALUATION
Startup Valuation Model
This bull riding financial plan template in Excel facilitates comprehensive valuation analysis through Discounted Cash Flow (DCF) methodology. By generating this valuation, users can seamlessly assess critical financial metrics, including residual value, replacement costs, and market comparables. Additionally, the template supports robust bull riding profitability analysis, enhancing your understanding of revenue streams and operational costs. With a focus on financial forecasting and risk assessment, this tool is essential for developing a sustainable bull riding business model while optimizing cash flow and improving profitability margins. Unlock the growth potential of your bull riding ventures today.

Cap Table
Our financial projection template includes a streamlined cap table, vital for bull riding ventures. This spreadsheet outlines ownership structures, detailing shares, options, and the investment amounts from sponsors. By incorporating bull riding profitability analysis and cash flow projections, you can effectively assess risk and manage expenses. Understanding ticket sales revenue and operational costs will enhance your investment strategy. Leverage sponsorship opportunities and conduct a thorough market analysis to drive financial forecasting and optimize profitability margins. Utilize this essential tool to ensure robust financial planning and business model development in the booming bull riding industry.

KEY FEATURES
A robust financial model enhances bull riding profitability analysis, guiding decisions on revenue streams and expense management for sustainable growth.
A robust financial model facilitates bull riding profitability analysis, enhancing decision-making through clear visibility into revenue streams and expenses.
A robust bull riding financial model enhances profitability analysis, optimizing revenue streams while managing expenses and maximizing growth potential.
Effective bull riding financial forecasting enhances decision-making by revealing cash flow impacts from new investments and operational changes.
Leverage a robust financial model to maximize bull riding profitability and enhance revenue streams through strategic expense management and planning.
This robust bull riding pro forma template enhances financial planning, optimizing profitability analysis and maximizing revenue streams for your events.
A robust bull riding financial model enhances profitability margins by optimizing expense management and maximizing revenue streams through strategic sponsorship opportunities.
Effective bull riding financial planning enhances profitability margins, ensuring sustained investor confidence and long-term business growth potential.
A robust bull riding financial model enhances revenue streams, optimizes expense management, and boosts profitability margins for sustainable growth.
This intuitive bull riding financial model empowers businesses to confidently forecast revenue streams and manage expenses for optimal profitability.
ADVANTAGES
A comprehensive bull riding financial model enhances profitability analysis, ensures effective expense management, and identifies lucrative revenue streams.
The bull riding financial model enhances profitability analysis by optimizing revenue streams and managing operational costs effectively.
The bull riding financial model enhances profitability analysis, optimizing revenue streams and expense management for sustainable growth and success.
Implementing a bull riding financial model enables precise cash flow projections, optimizing profitability and enhancing decision-making for future investments.
Utilizing a comprehensive financial model enhances bull riding profitability analysis and optimizes revenue streams while effectively managing operational costs.


